OPEN-SOURCE SCRIPT
Financial Astrology Mars Declination
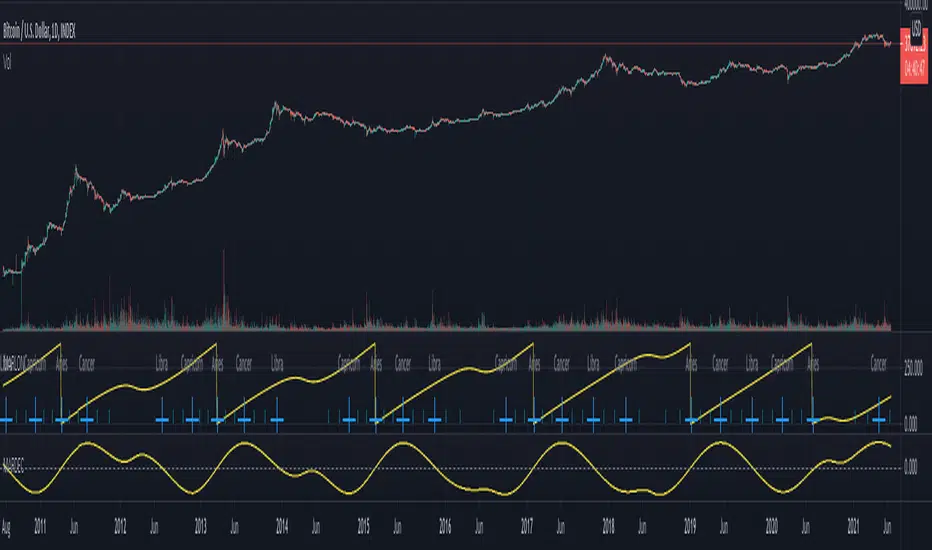
Mars crossing zero declination through the north direction exhibits more stronger force in the impulsive and aggressive price fluctuations, for BTCUSD we can see that in many of the occurrences there was very intense price action on this cryptocurrency. In the contrary when crossed the zero declination through the south declination direction, in many occurrences the price was in congestion / consolidation.
Is very likely that similar pattern repeats in others markets so will be great to get the participation of other financial astrologers that could research this declination cycle and share feedback with us.
Note: The Mars declination indicator is based on an ephemeris array that covers years 2010 to 2030, prior or after this years the declination is not available, this daily ephemeris are based on UTC time so in order to align properly with the price bars times you should set UTC as your chart reference timezone.
开源脚本
秉承TradingView的精神,该脚本的作者将其开源,以便交易者可以查看和验证其功能。向作者致敬!您可以免费使用该脚本,但请记住,重新发布代码须遵守我们的网站规则。
免责声明
这些信息和出版物并非旨在提供,也不构成TradingView提供或认可的任何形式的财务、投资、交易或其他类型的建议或推荐。请阅读使用条款了解更多信息。
免责声明
这些信息和出版物并非旨在提供,也不构成TradingView提供或认可的任何形式的财务、投资、交易或其他类型的建议或推荐。请阅读使用条款了解更多信息。