OPEN-SOURCE SCRIPT
Fibonacci Bands
Description
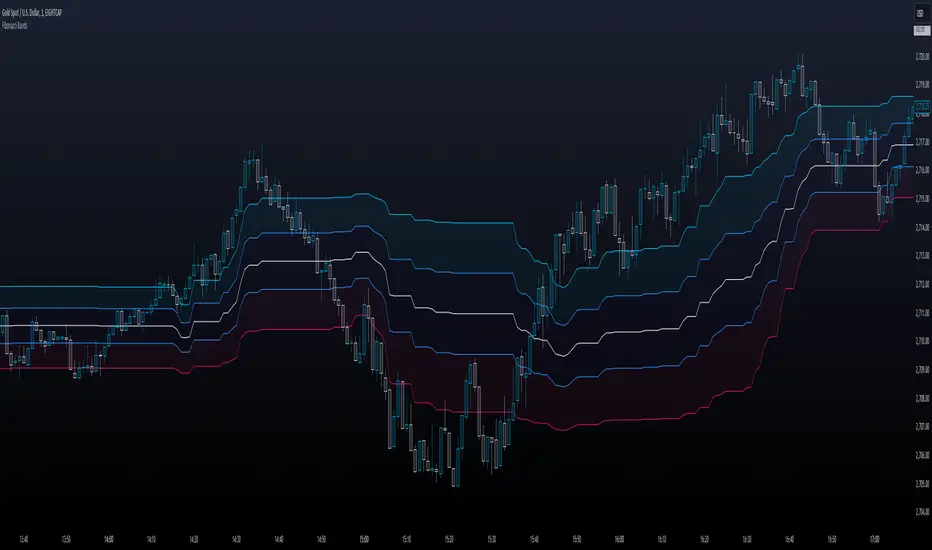
This indicator dynamically calculates Fibonacci retracement levels based on the highest high and lowest low over a specified lookback period. The key Fibonacci levels (0.236, 0.382, 0.5, 0.618, and 0.786) are plotted on the chart, with shaded areas between these levels for visual guidance.
How it works
Key Features
Unique Points
Fibonacci Focus: This script is specifically designed around Fibonacci retracement levels, which are popular among technical traders for identifying potential reversal points.
Dynamic Range Calculation: The use of the highest high and lowest low within a user-defined period offers a dynamic approach to adapting to changing market conditions.
How to use it
This indicator dynamically calculates Fibonacci retracement levels based on the highest high and lowest low over a specified lookback period. The key Fibonacci levels (0.236, 0.382, 0.5, 0.618, and 0.786) are plotted on the chart, with shaded areas between these levels for visual guidance.
How it works
- The script computes the highest high (hh) and the lowest low (ll) over the defined length.
- It calculates the price range (delta) as the difference between the highest high and the lowest low.
- Fibonacci levels are then determined using the formula: ℎℎ − (delta × Fibonacci ratio)
- Each Fibonacci level is then plotted as a line with a specific color.
Key Features
- Customizable Length: Users can adjust the lookback period to suit their trading strategy.
- Multiple Fibonacci Levels: Includes common Fibonacci retracement levels, providing traders with a comprehensive view of potential support and resistance areas.
- Visual Fillings: The script includes customizable shading between levels, which helps traders quickly identify key zones (like the "Golden Zone" between 0.5 and 0.618).
Unique Points
Fibonacci Focus: This script is specifically designed around Fibonacci retracement levels, which are popular among technical traders for identifying potential reversal points.
Dynamic Range Calculation: The use of the highest high and lowest low within a user-defined period offers a dynamic approach to adapting to changing market conditions.
How to use it
- Adjust the length parameter (default is 60) to determine how many bars back the indicator will calculate the highest high and lowest low. A longer length may provide a broader perspective of price action, while a shorter length may react more quickly to recent price changes.
- Observe the plotted Fibonacci levels: 0.236, 0.382, 0.5, 0.618, and 0.786. These levels often act as potential support and resistance points. Pay attention to how price interacts with these levels.
- When the price approaches a Fibonacci level, consider it a potential reversal point. The filled areas between the Fibonacci levels indicate zones where price might consolidate or reverse. The "Golden Zone" (between 0.5 and 0.618) is particularly significant; many traders watch this area closely for potential entry points in an uptrend or exit points in a downtrend.
开源脚本
秉承TradingView的精神,该脚本的作者将其开源,以便交易者可以查看和验证其功能。向作者致敬!您可以免费使用该脚本,但请记住,重新发布代码须遵守我们的网站规则。
免责声明
这些信息和出版物并非旨在提供,也不构成TradingView提供或认可的任何形式的财务、投资、交易或其他类型的建议或推荐。请阅读使用条款了解更多信息。
免责声明
这些信息和出版物并非旨在提供,也不构成TradingView提供或认可的任何形式的财务、投资、交易或其他类型的建议或推荐。请阅读使用条款了解更多信息。