OPEN-SOURCE SCRIPT
Mayer MA
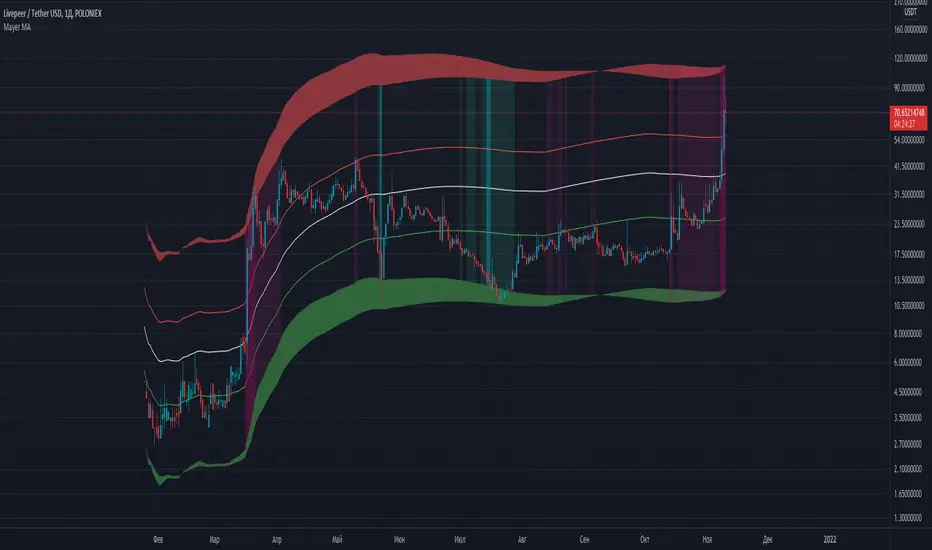
Mayer Multiple Price Bands Explained
The Mayer Multiple Price Bands chart is a simple modification to the original Mayer Multiple chart explained here.
Summary of Mayer Multiple
The Mayer Multiple is calculated by taking the price of Bitcoin and dividing it by the 200 day moving average value. The thinking behind the multiple is that by comparing the current price of bitcoin and its longer term moving average, you get a sense of if it is overbought (overvalued) or oversold (undervalued).
Adding Bands
The addition of price bands takes the multiple a step further by attempting to tell you how overbought or oversold bitcoin is with more detail. Instead of just three labels (overbought, fairly priced, and undervalued), you are given more granular labels: Oversold, Bearish, Bullish, Bullish Extension, and Overbought.
How to Calculate Mayer Multiple Bands
The Mayer multiple is calculated by taking the price of Bitcoin and dividing it by the 200 day moving average value. We take this a step further and display various prices that represent ‘bands’ of over and undervalued Bitcoin based on the multiple. They are as follows:
>2.5x: Overbought
>1.7x and <2.5x: Bullish Overextension
>1.1x and <1.7x Bullish Channel
>0.55x and <1.1x: Bearish Channel
<0.55x: Oversold
开源脚本
秉承TradingView的精神,该脚本的作者将其开源,以便交易者可以查看和验证其功能。向作者致敬!您可以免费使用该脚本,但请记住,重新发布代码须遵守我们的网站规则。
免责声明
这些信息和出版物并非旨在提供,也不构成TradingView提供或认可的任何形式的财务、投资、交易或其他类型的建议或推荐。请阅读使用条款了解更多信息。
免责声明
这些信息和出版物并非旨在提供,也不构成TradingView提供或认可的任何形式的财务、投资、交易或其他类型的建议或推荐。请阅读使用条款了解更多信息。