OPEN-SOURCE SCRIPT
已更新 Horizontal Lines from Current Price
This indicator will help traders track price fluctuations in smaller time frames more conveniently than ever before.
Here's how it works:
Additionally, we also provide volume display (measured in USD) at the current candle position to assist traders in keeping track of market momentum more closely.
Installation guide for indicators:
Here's how it works:
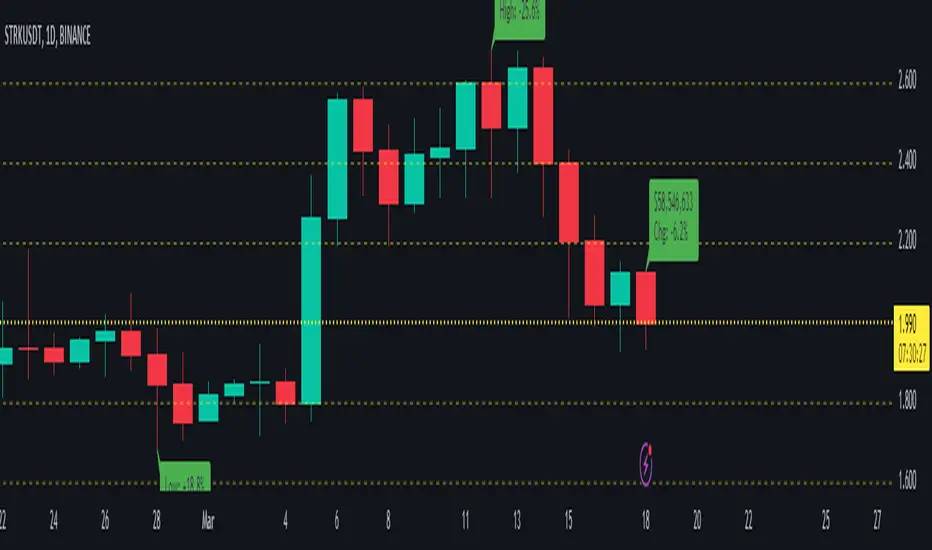
Starting from the current price, the indicator will draw horizontal lines spaced 10% apart.
Now, whenever zooming in or out of the chart, traders can visually determine the level of price volatility more easily.
Additionally, we also provide volume display (measured in USD) at the current candle position to assist traders in keeping track of market momentum more closely.
Installation guide for indicators:
After installing the indicator, make sure that the indicator is merged with the price chart.
Secondly, ensure that the scale bar of the indicator merges with the scale bar of the price chart.
版本注释
Update default inputs版本注释
Clean source code & Inputs版本注释
➕ Added the feature to view the highest and lowest price changes of the current bar compared to the previous bars.⚡⚡⚡版本注释
Clean source code 🚧🚧🚧版本注释
➕ Added the feature to view the changes in the current price bar.⚡⚡⚡版本注释
Clean source code 🚧🚧🚧版本注释
Update display current price 🚧🚧🚧版本注释
Fix bug 🚧🚧🚧版本注释
Fix bug 🚧🚧🚧版本注释
Fix bug 🚧🚧🚧版本注释
Fix bug 🚧🚧🚧版本注释
Fix bug 🚧🚧🚧版本注释
Fix bug 🚧🚧🚧版本注释
Fix bug 🚧🚧🚧开源脚本
秉承TradingView的精神,该脚本的作者将其开源,以便交易者可以查看和验证其功能。向作者致敬!您可以免费使用该脚本,但请记住,重新发布代码须遵守我们的网站规则。
免责声明
这些信息和出版物并非旨在提供,也不构成TradingView提供或认可的任何形式的财务、投资、交易或其他类型的建议或推荐。请阅读使用条款了解更多信息。
免责声明
这些信息和出版物并非旨在提供,也不构成TradingView提供或认可的任何形式的财务、投资、交易或其他类型的建议或推荐。请阅读使用条款了解更多信息。