OPEN-SOURCE SCRIPT
Moving Average Convergence Divergence and Momentum
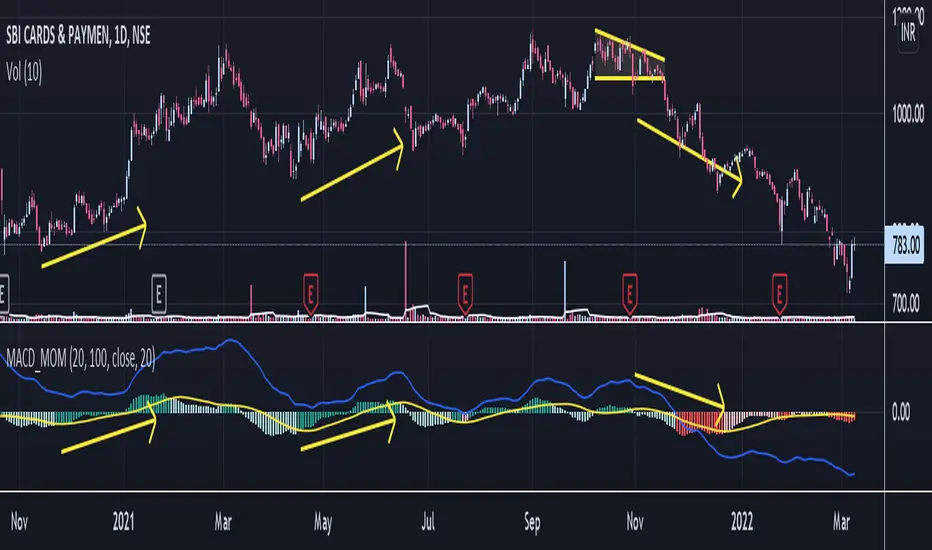
MACD line is difference between 20 EMA and 100 EMA which measures the Longterm trend. If MACD line is above Zero trend is positive. If MACD line is below zero trend is negative. Strategy is classic Buy in uptrend Sell in Downtrend.
To Improve the entry timing MACD histogram is used as Momentum. Histogram is the difference between MACD line and 20 EMA of MACD line. And Hist Momentum is the 20 SMA of histogram.
Advantage of histogram is Smoothness and better reliability than other momentum indicators like RSI which is volatile.
If MACD line is above zero = Trend is positive
and Histogram is above its SMA = Momentum is also positive.
Buy Signal.
If MACD line is above zero = Trend is positive
and Histogram is below its SMA = Trend is positive but Momentum is losing.
Look for Support levels or Break out of support level.
If MACD line is below zero = Trend is Negative
and Histogram is Below its SMA = Momentum is also Negative.
Sell Signal.
If MACD line is Below zero = Trend is Negative
and Histogram is above its SMA = Trend is negative but momentum is improving
Look for Resistance levels or Break out of resistance level.
开源脚本
秉承TradingView的精神,该脚本的作者将其开源,以便交易者可以查看和验证其功能。向作者致敬!您可以免费使用该脚本,但请记住,重新发布代码须遵守我们的网站规则。
免责声明
这些信息和出版物并非旨在提供,也不构成TradingView提供或认可的任何形式的财务、投资、交易或其他类型的建议或推荐。请阅读使用条款了解更多信息。
开源脚本
秉承TradingView的精神,该脚本的作者将其开源,以便交易者可以查看和验证其功能。向作者致敬!您可以免费使用该脚本,但请记住,重新发布代码须遵守我们的网站规则。
免责声明
这些信息和出版物并非旨在提供,也不构成TradingView提供或认可的任何形式的财务、投资、交易或其他类型的建议或推荐。请阅读使用条款了解更多信息。