OPEN-SOURCE SCRIPT
已更新 Dabel MS + FVG
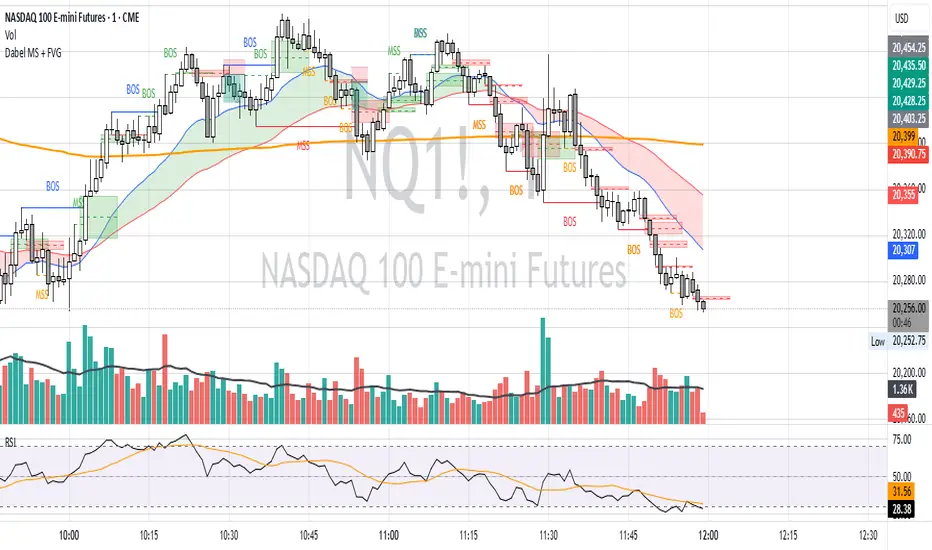
This script is designed to assist traders by identifying market structures, imbalances, and potential trade opportunities using Break of Structure (BOS) and Market Structure Shifts (MSS). It visually highlights imbalances in price action, key pivots, and market structure changes, providing actionable information for making trading decisions.
Key features:
Imbalances Detection: Highlights bullish and bearish price gaps (Fair Value Gaps) using colored boxes. Users can choose the line style (solid, dashed, or dotted) for imbalance midlines.
Market Structure Analysis: Tracks pivot highs and lows to identify BOS and MSS in two separate market structures with adjustable pivot strengths.
Customizable Visualization: Allows users to choose line styles, colors, and display options for both imbalances and market structures.
Alerts: Alerts traders when BOS or MSS occur, helping to monitor the market effectively.
Trading Strategy
Imbalance Trading:
Imbalances (gaps) represent areas where supply or demand was left unfilled. These gaps often act as magnet zones where the price revisits to fill.
Bullish Imbalance: Look for buying opportunities when price enters a green imbalance zone.
Bearish Imbalance: Look for selling opportunities when price enters a red imbalance zone.
Use the midline of the imbalance box as a key reference point for potential reversals.
Break of Structure (BOS) and Market Structure Shift (MSS):
BOS: Indicates a continuation of the existing trend. For example:
Bullish BOS: Look for continuation in the uptrend after a high is broken.
Bearish BOS: Look for continuation in the downtrend after a low is broken.
MSS: Suggests a potential reversal in market structure. For example:
Bullish MSS: Indicates a possible shift from a bearish to bullish market.
Bearish MSS: Indicates a potential shift from a bullish to bearish market.
Multiple Market Structures:
This script provide two sets of market structures, allowing traders to compare short-term and long-term trends.
Adjust the pivot strength to suit your trading style (lower for intraday trading, higher for swing or positional trading).
Entry and Exit:
Entry: Look for entries near imbalances or after confirmed BOS/MSS in line with the overall trend.
Exit: Place stop-loss below/above recent pivots and take profit at nearby support/resistance or imbalance zones.
For New Traders
Focus on Basics: Understand what BOS and MSS mean and how they signal trend direction or reversals.
Use Alerts: Rely on the script's alert system to catch important moments without staring at charts all day.
Start Small: Test this strategy on a demo account before using it live. You can understand it more with practice.
版本注释
Added :1. VWAP
- VWAP can act as dynamic support or resistance levels in intraday trading.
- VWAP work as a reference to determine if the price is above or below the average. Prices above VWAP indicate bullish sentiment, while prices below suggest bearish sentiment.
- VWAP can act as dynamic support or resistance levels in intraday trading.
- Since VWAP resets at the start of each trading session, it is primarily used for intraday analysis rather than long-term trends.
2. Moving Average
- User can choose to use Exponential Moving Average or Simple Moving Average.
- Moving averages often act as dynamic support or resistance levels.
- If the price is above the SMA/EMA, it suggests an uptrend. Below it indicates a downtrend.
This two added indicator only work as a confluence for previous strategies. However, you can use your own strategy and preference.
版本注释
Add option to display border for fvg box. User can choose color for the border.
开源脚本
秉承TradingView的精神,该脚本的作者将其开源,以便交易者可以查看和验证其功能。向作者致敬!您可以免费使用该脚本,但请记住,重新发布代码须遵守我们的网站规则。
免责声明
这些信息和出版物并非旨在提供,也不构成TradingView提供或认可的任何形式的财务、投资、交易或其他类型的建议或推荐。请阅读使用条款了解更多信息。
免责声明
这些信息和出版物并非旨在提供,也不构成TradingView提供或认可的任何形式的财务、投资、交易或其他类型的建议或推荐。请阅读使用条款了解更多信息。