INVITE-ONLY SCRIPT
已更新 TM_DAY_TRACKER
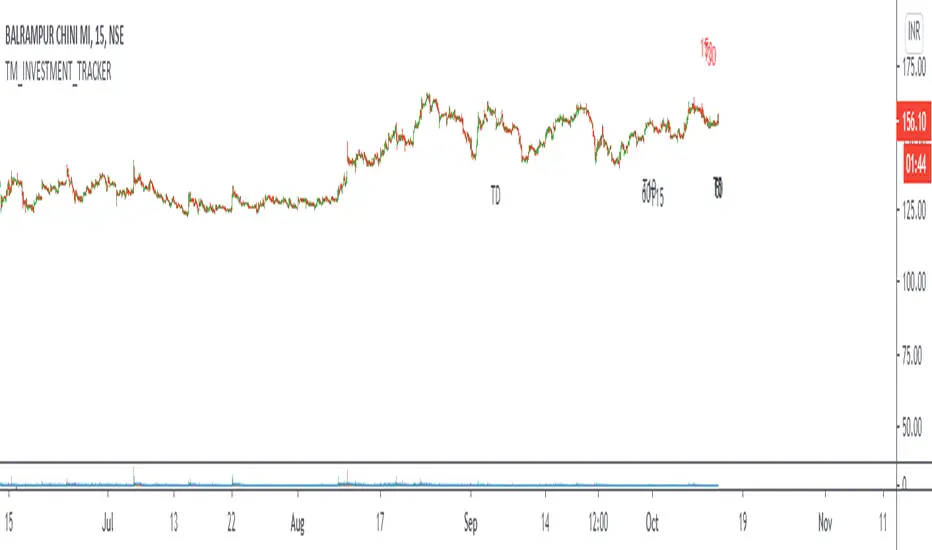
Day Tracker Indicator shows overall trend or market direction for Intraday / Swing Position along with Buy or sell signal.
Terminology Use ==> B- Buy, S- Sale Signal, and Numbers are to show timeframe indication there is presence of buyer or seller like B1 for buy signal on 1 minute timeframe etc.
Display and Interpretation ==> There are 3 lines in trend chart, line-1 light thin, line-2 dark less thick and line-3 bold thick. These lines having Green or Red color according to market signal and trend change where green for positive trend, red for negative trend
line-1 represents market strength and order build up; line-2 represents volatility or momentum ; line-3 represents market trend or direction
Timeframe ==> Use proper Signal with swing trend on 1 minute, 3 minute 5 minute, 15 minute time frame
What to Identify ==> Overall Trend for the intraday and swing Period
How to Use ==>
line-1 light thin "Green/Red" work as primary support / resistance and area of value. During the price movement price takes support or resistance here and bounce back or reverse back"
line-2 dark less thick "Green/Red" work as volatility line. This is area of volatility and direction to main trend. Price crossing above or below will give huge direction movement
line-3 bold thick "Green/Red" work as trend line or market direction line. This is area where strong or weak price will decide its direction
Note: - Use market structure, chart pattern, trend lines and price action parameter for more confirmation.
Entry ==>
Let’s wait the proper area of support or resistance ( Area of Value in case of trend pattern use)
Exit ==>
SL of swing high/low out of market structure with proper risk management and target with proper Risk/ Reward Ratio
版本注释
Updates仅限邀请脚本
只有作者授权的用户才能访问此脚本。您需要申请并获得使用许可。通常情况下,付款后即可获得许可。更多详情,请按照下方作者的说明操作,或直接联系TradingMind24。
TradingView不建议您付费购买或使用任何脚本,除非您完全信任其作者并了解其工作原理。您也可以在我们的社区脚本找到免费的开源替代方案。
作者的说明
免责声明
这些信息和出版物并非旨在提供,也不构成TradingView提供或认可的任何形式的财务、投资、交易或其他类型的建议或推荐。请阅读使用条款了解更多信息。
仅限邀请脚本
只有作者授权的用户才能访问此脚本。您需要申请并获得使用许可。通常情况下,付款后即可获得许可。更多详情,请按照下方作者的说明操作,或直接联系TradingMind24。
TradingView不建议您付费购买或使用任何脚本,除非您完全信任其作者并了解其工作原理。您也可以在我们的社区脚本找到免费的开源替代方案。
作者的说明
免责声明
这些信息和出版物并非旨在提供,也不构成TradingView提供或认可的任何形式的财务、投资、交易或其他类型的建议或推荐。请阅读使用条款了解更多信息。