OPEN-SOURCE SCRIPT
X 4H OR
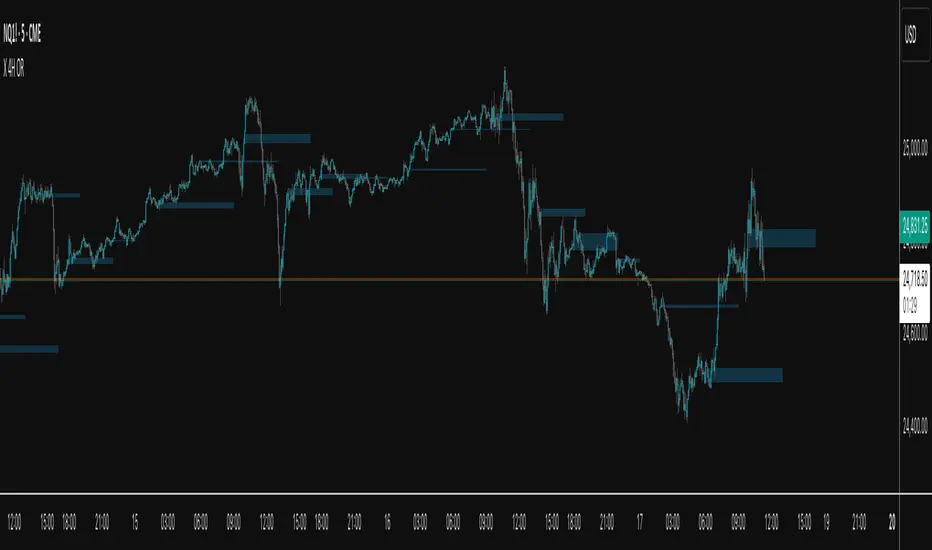
This indicator plots the 30-second opening range (high/low) for six New-York–time anchors—2am, 6am, 10am, 2pm, 6pm, and 10pm—and extends each box to a fixed end time (e.g., 2am→9am, 6am→1pm, etc.). It samples true 30-second data regardless of the chart timeframe, so the captured highs/lows are precise.
What it does
Builds the first 30s OR for each selected anchor and draws a time-anchored box for that session.
Archives every day’s boxes (up to a cap) so you can study how price interacts with past ranges.
Adds per-anchor show toggles to display the latest box for that anchor.
Adds a global History toggle to show/hide all archived boxes without deleting them (clean view vs. context view).
Uses borderless, color-coded fills per anchor to avoid edge distortion while keeping levels easy to read.
Why it’s useful
Quickly spot session inflection zones where liquidity, breakouts, or reversals cluster.
Compare how current price trades relative to recent session ranges for bias and risk framing.
Perform lightweight post-session review/backtesting on OR breaks, retests, and range rotations.
Keep charts decluttered on demand (latest only), or flip on history for deeper context.
开源脚本
秉承TradingView的精神,该脚本的作者将其开源,以便交易者可以查看和验证其功能。向作者致敬!您可以免费使用该脚本,但请记住,重新发布代码须遵守我们的网站规则。
免责声明
这些信息和出版物并非旨在提供,也不构成TradingView提供或认可的任何形式的财务、投资、交易或其他类型的建议或推荐。请阅读使用条款了解更多信息。
开源脚本
秉承TradingView的精神,该脚本的作者将其开源,以便交易者可以查看和验证其功能。向作者致敬!您可以免费使用该脚本,但请记住,重新发布代码须遵守我们的网站规则。
免责声明
这些信息和出版物并非旨在提供,也不构成TradingView提供或认可的任何形式的财务、投资、交易或其他类型的建议或推荐。请阅读使用条款了解更多信息。