INVITE-ONLY SCRIPT
已更新 DOP - Load-Level Identification & Setup Assistant (L.I.S.A)
This toolkit is made up of more than 3+ innovative indicators that have been designed to assist people in trading smart-money concepts. Get access to a variety of trading tools & relevant data all within one indicator to create your own, smart-money trading strategy.
Catering To SMART-Money Trading Styles
Our toolkit works in any market & allows users to:
• Detect the trend of the market by displaying real-time changes in market structure.
• Detect institutional activity in the market by highlighting structural changes.
• Get automatic order block support and resistance levels in real-time to assist with order entry placement and target take profit levels.
• Timely removal of order blocks that have been run through to give a clear picture of current market structure.
How Does It Work?
The algorithm tracks key pivot points within market data and when these are broken by price movements it provides key information to the user such as when it broke structure, where it broke structure and what levels are now considered support and resistance.
Trend Bar Colouring
The trend bar colouring feature provides a clear visual indication of the market trend by colouring candles red or green depending on the last break in market structure.
Market Structure Breaks
Breaks in market structure are displayed with a single line between two candles, this indicates that there may have been a shift in market trend.
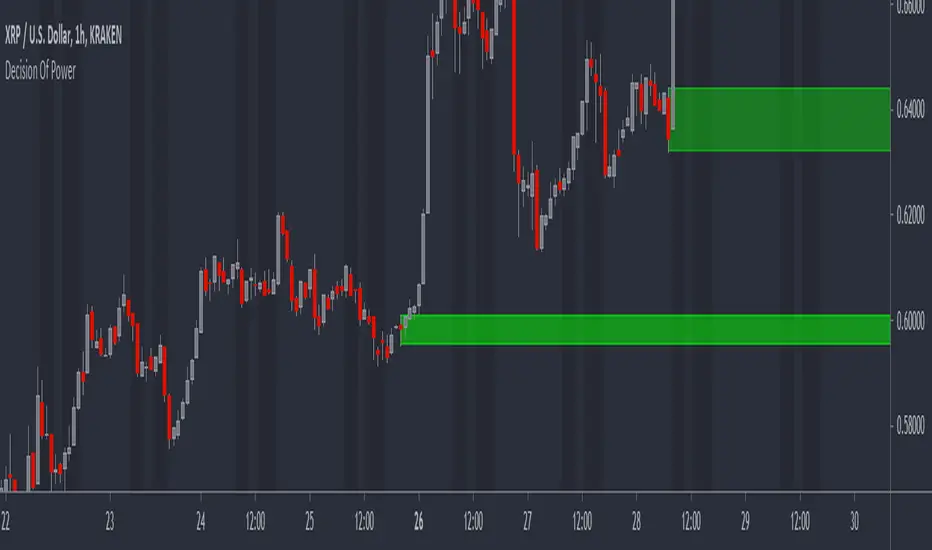
Order Block Levels
Once structure breaks it creates support and resistance levels which can help in trade entries and deciding on take profit targets; these are displayed in real-time with colour coded boxes at either the support or resistance levels. If a level has been broken it is automatically removed from the chart to give a clear representation of the current market state.
If you are using this script you acknowledge past performance is not necessarily indicative of future results and there are many more factors that go into being a profitable trader.
You can see the Author's instructions below to get instant-access to this indicator.
Catering To SMART-Money Trading Styles
Our toolkit works in any market & allows users to:
• Detect the trend of the market by displaying real-time changes in market structure.
• Detect institutional activity in the market by highlighting structural changes.
• Get automatic order block support and resistance levels in real-time to assist with order entry placement and target take profit levels.
• Timely removal of order blocks that have been run through to give a clear picture of current market structure.
How Does It Work?
The algorithm tracks key pivot points within market data and when these are broken by price movements it provides key information to the user such as when it broke structure, where it broke structure and what levels are now considered support and resistance.
Trend Bar Colouring
The trend bar colouring feature provides a clear visual indication of the market trend by colouring candles red or green depending on the last break in market structure.
Market Structure Breaks
Breaks in market structure are displayed with a single line between two candles, this indicates that there may have been a shift in market trend.
Order Block Levels
Once structure breaks it creates support and resistance levels which can help in trade entries and deciding on take profit targets; these are displayed in real-time with colour coded boxes at either the support or resistance levels. If a level has been broken it is automatically removed from the chart to give a clear representation of the current market state.
If you are using this script you acknowledge past performance is not necessarily indicative of future results and there are many more factors that go into being a profitable trader.
You can see the Author's instructions below to get instant-access to this indicator.
版本注释
This update includes the following: -• Improved order block detection and performance on higher timeframes.
• The option to display higher timeframe levels alongside the existing chart.
• The option to highlight the break of structure candle.
版本注释
This update includes the following new features: -• Equal Low Detection and Highlighting
• Equal High Detection and Highlighting
版本注释
We have updated the equal high/low detection to make it more accurate by including pivot points版本注释
We have refined the load level detection and removed some features to keep the charts clean and easy to read. Features have also been added to help identify valid entry points including the highlighting of PAZ and trade zones.
版本注释
Updated order blocks to make them more clear and amended trade zones.仅限邀请脚本
只有作者授权的用户才能访问此脚本。您需要申请并获得使用许可。通常情况下,付款后即可获得许可。更多详情,请按照下方作者的说明操作,或直接联系DarrenPallatina。
TradingView不建议您付费购买或使用任何脚本,除非您完全信任其作者并了解其工作原理。您也可以在我们的社区脚本找到免费的开源替代方案。
作者的说明
Use the link below to obtain access to this indicator: -
https://www.decisionofpower.com
Alternatively, you can PM us to obtain access.
免责声明
这些信息和出版物并非旨在提供,也不构成TradingView提供或认可的任何形式的财务、投资、交易或其他类型的建议或推荐。请阅读使用条款了解更多信息。
仅限邀请脚本
只有作者授权的用户才能访问此脚本。您需要申请并获得使用许可。通常情况下,付款后即可获得许可。更多详情,请按照下方作者的说明操作,或直接联系DarrenPallatina。
TradingView不建议您付费购买或使用任何脚本,除非您完全信任其作者并了解其工作原理。您也可以在我们的社区脚本找到免费的开源替代方案。
作者的说明
Use the link below to obtain access to this indicator: -
https://www.decisionofpower.com
Alternatively, you can PM us to obtain access.
免责声明
这些信息和出版物并非旨在提供,也不构成TradingView提供或认可的任何形式的财务、投资、交易或其他类型的建议或推荐。请阅读使用条款了解更多信息。