PROTECTED SOURCE SCRIPT
已更新 LA_Periodic_Fibonacci Levels
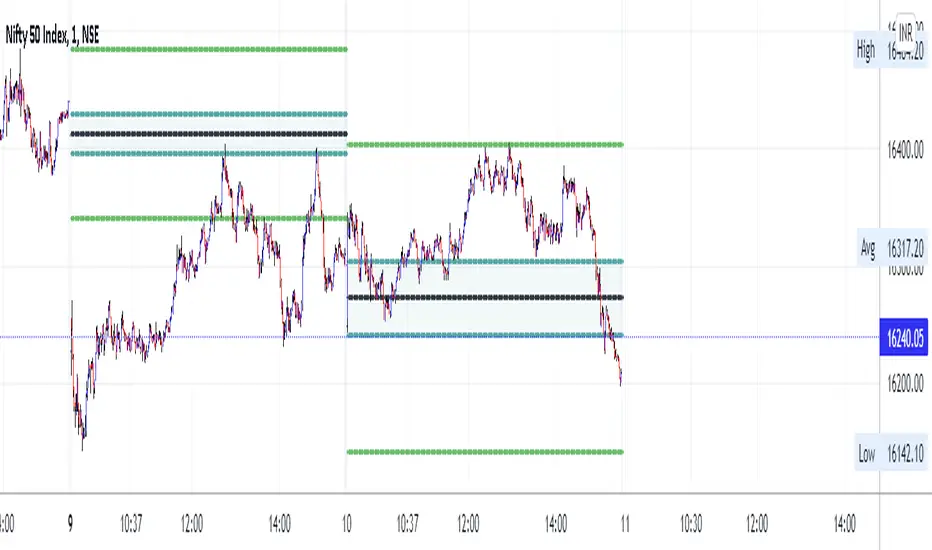
This indicator is used to plot the previous high and low of the chosen timeframe along with the Fibonacci levels of 0.50, +/- 0.618 and +/- 0.786.
Provision is given to plot levels for three different time frames at a time.
Options are given to select/unselect the levels as per the user requirement. For plotting the Fibonacci levels of a specific period, user has to select the option "TF1_Fib" or "TF2_Fib" or "TF3_Fib" along with the respective levels (50, +/- 0.618, +/- 0.786).
User has to add different time frames in their layout which can then be used in the drop down menu. By default, daily, weekly and monthly time frames are given.
Indicator is plotted as the candle progresses and not plotted for future time frames in advance.
Below are few examples on larger timeframes.
BTCUSD on 1 min TF (timeframe)

BTCUSD on Daily TF

DJI on Daily TF

Provision is given to plot levels for three different time frames at a time.
Options are given to select/unselect the levels as per the user requirement. For plotting the Fibonacci levels of a specific period, user has to select the option "TF1_Fib" or "TF2_Fib" or "TF3_Fib" along with the respective levels (50, +/- 0.618, +/- 0.786).
User has to add different time frames in their layout which can then be used in the drop down menu. By default, daily, weekly and monthly time frames are given.
Indicator is plotted as the candle progresses and not plotted for future time frames in advance.
Below are few examples on larger timeframes.
BTCUSD on 1 min TF (timeframe)
BTCUSD on Daily TF
DJI on Daily TF
版本注释
We have included the 1.272 and 1.618 levels for projections. User can select the levels accordinglyNifty50 on a Daily chart with indicator for 12 months
Nifty50 on 1min chart with indicator for 1 hour
受保护脚本
此脚本以闭源形式发布。 但是,您可以自由使用,没有任何限制 — 了解更多信息这里。
@aravindleo_45
免责声明
这些信息和出版物并非旨在提供,也不构成TradingView提供或认可的任何形式的财务、投资、交易或其他类型的建议或推荐。请阅读使用条款了解更多信息。
受保护脚本
此脚本以闭源形式发布。 但是,您可以自由使用,没有任何限制 — 了解更多信息这里。
@aravindleo_45
免责声明
这些信息和出版物并非旨在提供,也不构成TradingView提供或认可的任何形式的财务、投资、交易或其他类型的建议或推荐。请阅读使用条款了解更多信息。