INVITE-ONLY SCRIPT
已更新 MomentumQ Dash
MomentumQ Dash – Multi-Timeframe & Watchlist Dashboard
The MomentumQ Dash is a professional dashboard-style indicator designed to help traders quickly evaluate market conditions across multiple timeframes and assets.
Unlike single-signal tools, MomentumQ Dash consolidates market regime, buy/sell conditions, and pre-signal alerts into an easy-to-read table, allowing traders to stay focused on actionable setups without flipping between charts.
All signals displayed in MomentumQ Dash are derived from the MomentumQ Oscillator (MoQ Osci), our proprietary tool designed to identify momentum shifts and adaptive buy/sell conditions. By integrating these signals into a dashboard format, MomentumQ Dash provides a structured overview of the market that is both comprehensive and easy to interpret.
A unique advantage of this tool is the dual-table system:
This combination gives traders a complete market overview at a glance, supporting both intraday and higher-timeframe strategies.
Key Features
1. Multi-Timeframe Signal Dashboard
2. Watchlist Asset Table
3. Flexible Layout & Theme Integration
4. MoQ Osci Signal Engine
How It Works
Timeframe Analysis
Trend Regime Detection
Watchlist Tracking
How to Use This Indicator
This indicator works on all TradingView markets: Forex, Stocks, Crypto, Futures, and Commodities.
Why Is This Indicator Valuable?
Example Trading Approaches
1. Multi-Timeframe Alignment
2. Cross-Market Confirmation
3. Pre-Signal Monitoring
Disclaimer
This indicator is a technical analysis tool and does not guarantee profits.
It should be used as part of a complete trading plan that includes risk management.
Past performance is not indicative of future results.
The MomentumQ Dash is a professional dashboard-style indicator designed to help traders quickly evaluate market conditions across multiple timeframes and assets.
Unlike single-signal tools, MomentumQ Dash consolidates market regime, buy/sell conditions, and pre-signal alerts into an easy-to-read table, allowing traders to stay focused on actionable setups without flipping between charts.
All signals displayed in MomentumQ Dash are derived from the MomentumQ Oscillator (MoQ Osci), our proprietary tool designed to identify momentum shifts and adaptive buy/sell conditions. By integrating these signals into a dashboard format, MomentumQ Dash provides a structured overview of the market that is both comprehensive and easy to interpret.
A unique advantage of this tool is the dual-table system:
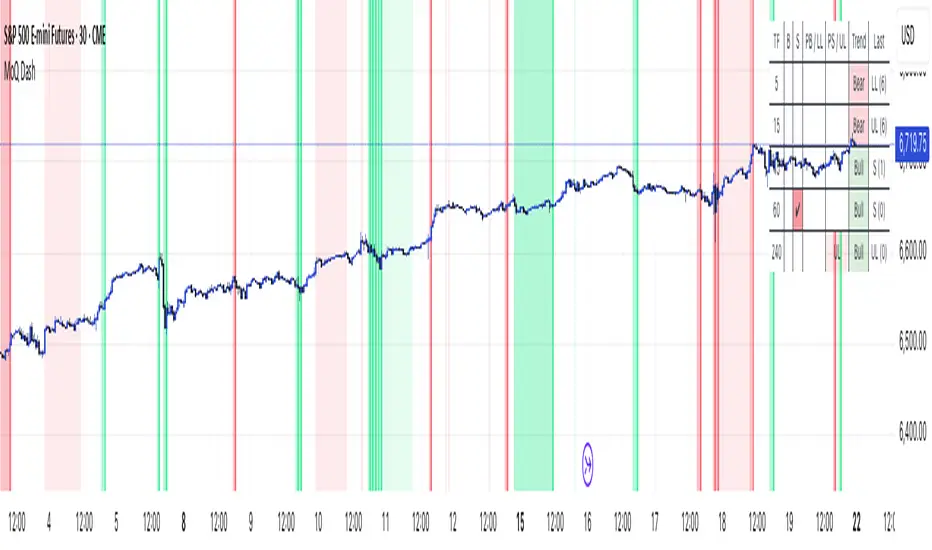
- A timeframe table that tracks the current symbol across five user-defined timeframes.
- A watchlist table that monitors up to five different assets on the same timeframe.
This combination gives traders a complete market overview at a glance, supporting both intraday and higher-timeframe strategies.
Key Features
1. Multi-Timeframe Signal Dashboard
- Tracks buy, sell, pre-buy, and pre-sell conditions for up to 5 configurable timeframes.
- Highlights market regime (Bull/Bear) with background colors for quick visual recognition.
- Displays the last detected signal and how many bars ago it occurred.
2. Watchlist Asset Table
- Monitor up to 5 custom symbols (e.g., indices, commodities, crypto pairs) in one view.
- Independent timeframe selection for the watchlist table.
- Clean symbol display with exchange prefixes automatically removed.
3. Flexible Layout & Theme Integration
- Choice of table position (Top Right, Middle Right, Bottom Right) for each table.
- Light/Dark mode setting for seamless chart integration.
- Compact, minimal design to avoid clutter.
4. MoQ Osci Signal Engine
- Signals are powered by the MomentumQ Oscillator (MoQ Osci), which uses adaptive momentum analysis.
- Identifies early pre-signals (potential setup zones) as well as confirmed buy/sell events.
- Helps traders recognize transitions in market structure without lagging indicators.
How It Works
Timeframe Analysis
- The indicator calculates MoQ Osci signals on each timeframe.
- When price deviates beyond upper/lower adaptive thresholds, buy/sell signals are generated.
- Pre-signals are displayed when price approaches these zones, offering early alerts.
Trend Regime Detection
- Regime is derived from MoQ Osci’s momentum distance relative to its adaptive mean.
- Bull regime = positive momentum bias; Bear regime = negative momentum bias.
- This provides a simple but reliable context for trade direction.
Watchlist Tracking
- Signals are calculated identically for each custom symbol selected by the user.
- Results are presented in a compact table, making it easy to spot alignment or divergence across markets.
How to Use This Indicator
- Use the Timeframe Table to align intraday setups with higher-timeframe context.
- Monitor the Watchlist Table to track correlated assets (e.g., SPX, NDX, VIX, Oil, Gold).
- Pay attention to pre-buy / pre-sell warnings for early setup confirmation.
- Use the “Last” column to quickly check the most recent signal and its timing.
- Combine with your existing price action strategy to validate entries and exits.
This indicator works on all TradingView markets: Forex, Stocks, Crypto, Futures, and Commodities.
Why Is This Indicator Valuable?
- Provides a complete dashboard view of market conditions in one place.
- Combines multi-timeframe confirmation with multi-asset monitoring.
- Signals are based on the proven MoQ Osci tool, ensuring consistency across strategies.
- Saves time and reduces the need to constantly switch charts.
- Fully customizable to match any trading workflow.
Example Trading Approaches
1. Multi-Timeframe Alignment
- Wait for a buy signal on the lower timeframe (e.g., 15m) while the higher timeframe (1h/4h) is in Bull regime.
- Enter long with higher-timeframe confirmation, improving trade probability.
2. Cross-Market Confirmation
- If SPX and NDX both trigger sell signals while VIX shows a buy, this may confirm risk-off sentiment.
- Use this confluence to support trade decisions in equities or correlated markets.
3. Pre-Signal Monitoring
- Watch for PB (Pre-Buy) or PS (Pre-Sell) warnings before confirmed signals.
- These can highlight potential breakout or reversal zones before they occur.
Disclaimer
This indicator is a technical analysis tool and does not guarantee profits.
It should be used as part of a complete trading plan that includes risk management.
Past performance is not indicative of future results.
版本注释
MoQ Dash — V1.1What’s New
Full Dark Mode Support (Manual)
New theme setting to switch between Light and Dark for high-contrast, readable tables and badges.
How to Use
- Open Indicator Settings → Theme and select Dark (or Light).
- Optional: tweak colors in Settings → Colors to match your palette.
Why It Helps
- Cleaner visuals on dark charts
- Consistent look across Timeframe & Watchlist tables, regimes, and signals
Notes
Signals/logic unchanged—this is a visual update only.
Thank You
Your feedback guided this polish. We’ll keep optimizing for clarity and speed.
Disclaimer
MoQ Dash supports technical analysis and is not financial advice. Always manage risk.
版本注释
MoQ Dash — V2.0What’s New
1. VIX Risk On/Off Overlay (corr-aware)
Prioritized signals (Strong > Pre > Flip). Colors can auto-invert based on current VIX↔asset correlation (Auto/Negative/Positive).
2. Custom Driver Risk On/Off Overlay
Choose any driver (default DXY) to derive risk regimes on your chart. Correlation flip with adjustable lookback.
3. Cleaner, Theme-Aware Tables
Dark/Light header contrast, clearer B/S highlights, PB/PS warnings, subtle LL/UL shading, and a readable Trend cell.
4. Tooltips Everywhere
Inputs now explain priorities, correlation logic, and suggested transparency.
Why It Helps
- Faster macro read of Risk ON/OFF from VIX or a custom driver.
- Less ambiguity thanks to strict priority (Strong > Pre > Flip).
- Cleaner visuals—important info pops without clutter.
How to Use
1. Overlays → enable VIX Risk On/Off or Driver Risk On/Off.
Pick correlation mode (Auto/Negative/Positive) and length; for Driver, select your symbol (e.g., TVC:DXY, TVC:VIX, BTCUSD, US10Y).
2. Tables → “Table Settings” for the main TF table; “Watchlist Table — *” to toggle, set timeframe, symbols, and position.
3. Theme → “Theme Settings” to match Light/Dark.
Signal Glossary (Table & Overlays)
- B (Buy) — High-probability bullish reversal setup.
- S (Sell) — High-probability bearish reversal setup.
- PB (Pre-Buy) — Heads-up: price may flip up soon (early bullish pressure).
- PS (Pre-Sell) — Heads-up: price may flip down soon (early bearish pressure).
- UL (Upper Limit) — Price pressing the upper band; momentum may slow or flip down.
- LL (Lower Limit) — Price pressing the lower band; momentum may slow or flip up.
Notes on Priority & Correlation
Priority: Strong > Pre > Flip. If a Strong signal exists, it overrides others.
Correlation (Auto): computed on 1-bar returns; colors flip when correlation ≥ 0 (positive/zero).
Instructions for Traders
Update Your Indicator: Remove the old MoQ Dash and add the new version so inputs/defaults load cleanly.
Customize: Tune correlation length and color opacities; edit watchlist symbols to match your workflow.
Disclaimer
MoQ Dash is a decision-support tool, not a guarantee of profits or outcomes. Use sound risk management and consult a financial professional when needed.
Thank You
Your feedback powers these improvements. Keep it coming—we’ll keep refining MoQ Dash for clarity, context, and control.
仅限邀请脚本
只有作者授权的用户才能访问此脚本。您需要申请并获得使用许可。通常情况下,付款后即可获得许可。更多详情,请按照下方作者的说明操作,或直接联系MomentumQ。
TradingView不建议您付费购买或使用任何脚本,除非您完全信任其作者并了解其工作原理。您也可以在我们的社区脚本找到免费的开源替代方案。
作者的说明
Access the MoQ Dash:
Message Us: Use the "Message" button on our profile.
Include Details: Share your username and needs.
Await Reply: Expect a response within 24 hours.
免责声明
这些信息和出版物并非旨在提供,也不构成TradingView提供或认可的任何形式的财务、投资、交易或其他类型的建议或推荐。请阅读使用条款了解更多信息。