OPEN-SOURCE SCRIPT
Stoch_RSI
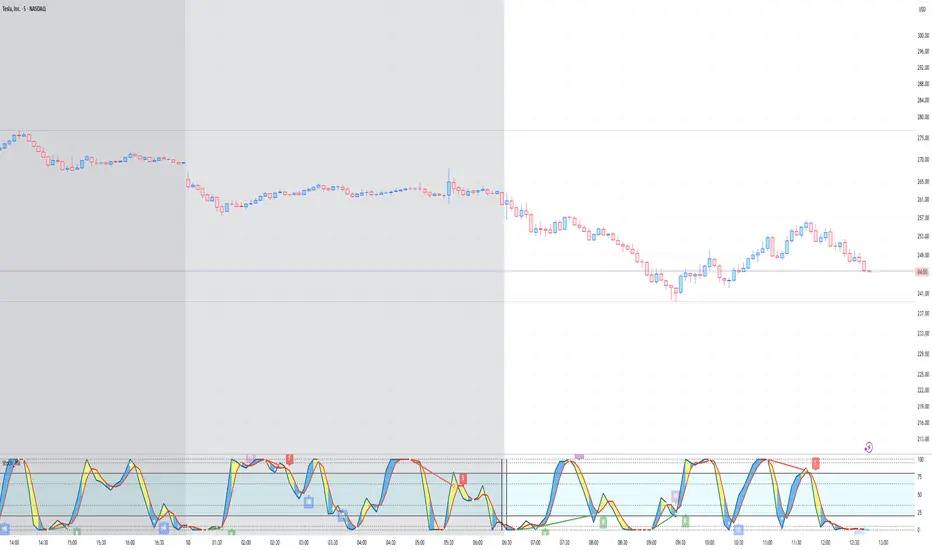
Stochastic RSI – Advanced Divergence Indicator
This custom indicator is an advanced version of the Stochastic RSI that not only smooths and refines the classic RSI input but also automatically detects both regular and hidden divergences using two powerful methods: fractal-based and pivot-based detection. Originally inspired by contributions from fskrypt, RicardoSantos, and later improved by developers like NeoButane and fymd, this script has been fully refined for clarity and ease-of-use.
Key Features:
Dual Divergence Detection:
Fractal-Based Divergence: Uses a four-candle pattern to confirm top and bottom fractals for bullish and bearish divergences.
Pivot-Based Divergence: Employs TradingView’s built-in pivot functions for an alternate view of divergence conditions.
Customizable Settings:
The inputs are organized into logical groups (Stoch RSI settings, Divergence Options, Labels, and Market Open Settings) allowing you to adjust smoothing periods, RSI and Stochastic lengths, and divergence thresholds with a user-friendly interface.
Visual Enhancements:
Plots & Fills: The indicator plots both the K and D lines with corresponding fills and horizontal bands for quick visual reference.
Divergence Markers: Diamond shapes and labeled markers indicate regular and hidden divergences on the chart.
Market Open Highlighting: Optional histogram plots highlight the market open candle based on different timeframes for stocks versus non-forex symbols.
开源脚本
秉承TradingView的精神,该脚本的作者将其开源,以便交易者可以查看和验证其功能。向作者致敬!您可以免费使用该脚本,但请记住,重新发布代码须遵守我们的网站规则。
免责声明
这些信息和出版物并非旨在提供,也不构成TradingView提供或认可的任何形式的财务、投资、交易或其他类型的建议或推荐。请阅读使用条款了解更多信息。
免责声明
这些信息和出版物并非旨在提供,也不构成TradingView提供或认可的任何形式的财务、投资、交易或其他类型的建议或推荐。请阅读使用条款了解更多信息。