Knowing how to work with the datas in a company's financial statements is an essential skill for stock investors. The meaningful interpretation and analysis of balance sheets, income statements, and cash flow statements to discern a company's investment qualities is the basis for smart investment choices.
You can access to the financials tables of the companies as a summary with this indicator.
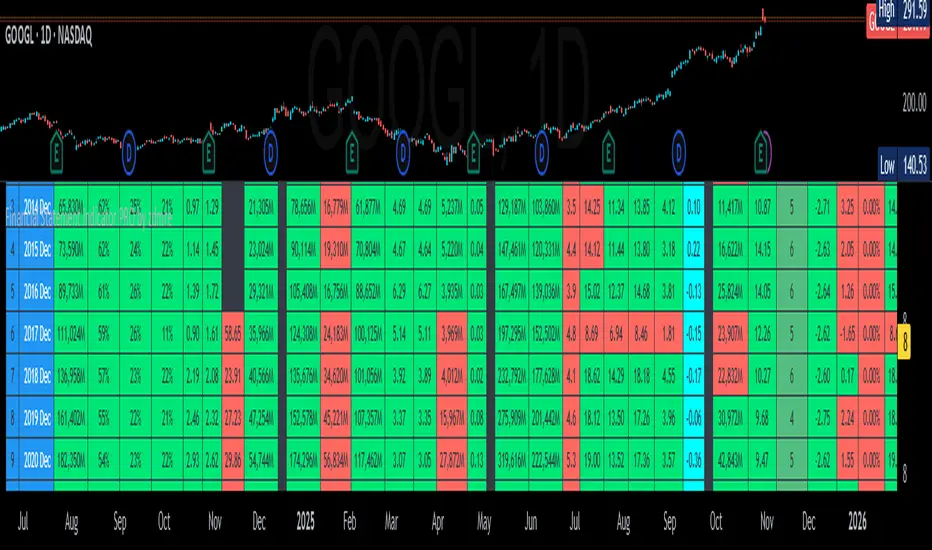
3 Tables;
Income Statement Table:
Revenue
Net Profit
EPS
EPS-D
P/E
Balance Sheet Table:
Current Asset
Total Asset
Total Equity
Book Value per Share
Total Debt
Debt/Equity
Statistics & Cash Flow Table:
Return On Equity
Return On Asset
Return On Invested Capital
Quick Ratio
Free Cash Flow
You can access to the financials tables of the companies as a summary with this indicator.
3 Tables;
Income Statement Table:
Revenue
Net Profit
EPS
EPS-D
P/E
Balance Sheet Table:
Current Asset
Total Asset
Total Equity
Book Value per Share
Total Debt
Debt/Equity
Statistics & Cash Flow Table:
Return On Equity
Return On Asset
Return On Invested Capital
Quick Ratio
Free Cash Flow
版本注释
- Added Tooltips
Added Filtering Data by Color
Fixed P/E Ratio
版本注释
- Added editable Text Color option.
版本注释
Fixed "FUND Error"Added EPS-D & P/E (Plot Data)
版本注释
Fixed Basic EPS
P/E Ratio
版本注释
- Added BETA Value and improvements made to the visuals.
版本注释
Removed
- BVPS (Book Value Per Share)
Added
*P/B (Price-to-Book Ratio)
*ROE/PB (Return on Equity / Price-to-Book Ratio)
*EPS Est (Earning Per Share Estimated)
版本注释
- Fixed Earnings Date problem.
版本注释
Added 4th Table and improvements made to the visuals.Statistics (Others):
Dividend Payout
Dividend Yield
PEG Ratio
PE Ratio (Forward 1y)
Sustainable Growth Rate (SGR)
Altman Z-SCORE
Beneish Model
Graham Number
Piotroski Score
Springate Score
Zmijewski Score
版本注释
New design - Added Headers
Added Tooltips for Titles
Table & Cell merging
版本注释
Added Net Margin / Operating Margin FilterHidden NaN values
版本注释
- Some additions have been made to the Plot data.
- The EPS data has been changed from Basic to Diluted.
- Minor UI improvements.
版本注释
Bug fixes.版本注释
What's New? I've added four critical metrics:
- Gross Margin
- Current Ratio
- Working Capital
- EBITDA
What's Improved?
Tables Reorganized: I've completely restructured the data into 4 logical tables (Profitability, Financial Health, Performance, Advanced Analytics) to make the analysis flow better.
Better Visuals: The color-coding system is now more consistent. The gradients for the Altman Z-Score and Piotroski F-Score are now much more informative.
More Data: You can now analyze 24 periods instead of 10.
Configurable Beta: You can now change the benchmark (default is SPX).
All settings menus and tooltips have been cleaned up to be more understandable.
What's Removed?
I removed a few metrics to streamline the analysis and reduce clutter:
Graham Numbers: Limited practical use in modern analysis.
Dividend Payout Ratio: Dividend Yield already covers this.
Technical Fixes
Cleaned up and optimized the code in the background.
Fixed several minor bugs related to color logic, NA value handling, and array indexing.
开源脚本
秉承TradingView的精神,该脚本的作者将其开源,以便交易者可以查看和验证其功能。向作者致敬!您可以免费使用该脚本,但请记住,重新发布代码须遵守我们的网站规则。
免责声明
这些信息和出版物并非旨在提供,也不构成TradingView提供或认可的任何形式的财务、投资、交易或其他类型的建议或推荐。请阅读使用条款了解更多信息。
免责声明
这些信息和出版物并非旨在提供,也不构成TradingView提供或认可的任何形式的财务、投资、交易或其他类型的建议或推荐。请阅读使用条款了解更多信息。