INVITE-ONLY SCRIPT
已更新 Bank Nifty Weighted Money Flow
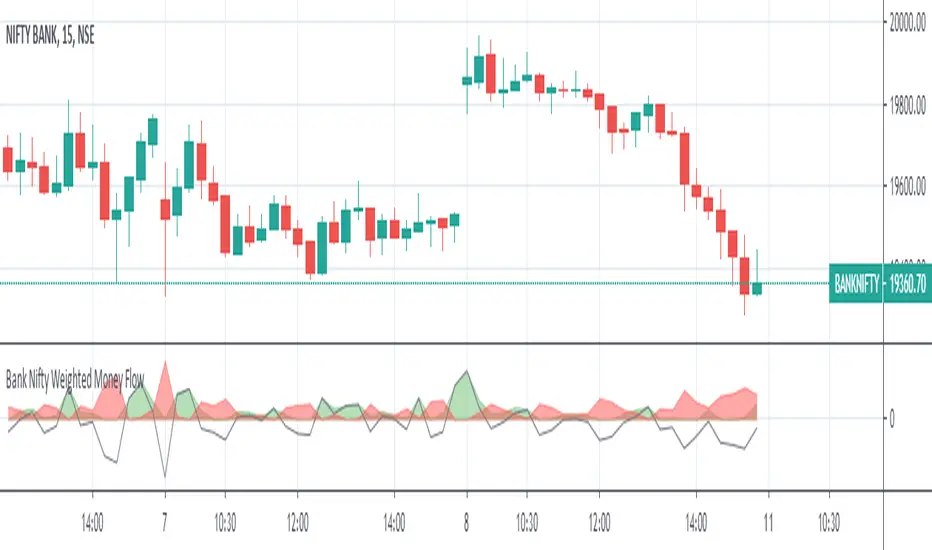
The indicator comprises of 2 areas ( one in green and another in red ) that depict the money flowing in and out the underlying 12 banks under BANK NIFTY index
The money flowing in and flowing out is calculated by identifying the buying pressure and selling pressure of each of 12 underlying banks within a 15 minute period ( which is internally further broken down by 15 one minute candles ), there by identifying the buy volume and sell volume multiplied by the price of the stock for the given minute aggregated for 15 minutes
The derived value for each bank is further weighted as per their weight in the index ( as of May 2nd 2020 ) and then summed up separately for both money flowing in and flowing out and plotted which shall help traders take decision based on the magnitude of money flowing in and out ( the weights shall be updated as and when the same changes in the index calculations )
The green color area represents the money flown in and the red color area represents the money that has flown out
A gradually increasing green area along with the decrease in the red area can be considered as the market is more into buying and less into selling and vice versa ( this can be observed in the chart before the rally begins , there should be an increasing green area which could potentially signifies money has started to flow in )
An equal or almost equal areas could signify a sideways market and the black line moving across shows the difference of money flowing and flowing out
Comments and feedback are welcome
Should you have any doubts or wish to access the script then please feel free to DM me.
***** The indicator works only in 15 minutes time frame *****
版本注释
Made minor correction to the weights版本注释
Made minor update to the logic for calculating the volume across multiple periods and the color of the buy and sell difference line版本注释
1) Updated to make the indicator independent of the time frame selected i.e the indicator would not now shows the money flowing in for the time frame selected 2) Update the color transparency for a better visibility
3)Upgraded to version 4
仅限邀请脚本
只有作者授权的用户才能访问此脚本。您需要申请并获得使用许可。通常情况下,付款后即可获得许可。更多详情,请按照下方作者的说明操作,或直接联系srinivasbusy。
TradingView不建议您付费购买或使用任何脚本,除非您完全信任其作者并了解其工作原理。您也可以在我们的社区脚本找到免费的开源替代方案。
作者的说明
免责声明
这些信息和出版物并非旨在提供,也不构成TradingView提供或认可的任何形式的财务、投资、交易或其他类型的建议或推荐。请阅读使用条款了解更多信息。
仅限邀请脚本
只有作者授权的用户才能访问此脚本。您需要申请并获得使用许可。通常情况下,付款后即可获得许可。更多详情,请按照下方作者的说明操作,或直接联系srinivasbusy。
TradingView不建议您付费购买或使用任何脚本,除非您完全信任其作者并了解其工作原理。您也可以在我们的社区脚本找到免费的开源替代方案。
作者的说明
免责声明
这些信息和出版物并非旨在提供,也不构成TradingView提供或认可的任何形式的财务、投资、交易或其他类型的建议或推荐。请阅读使用条款了解更多信息。