OPEN-SOURCE SCRIPT
已更新 RSI/Stochastic With Real Time Candle Overlay
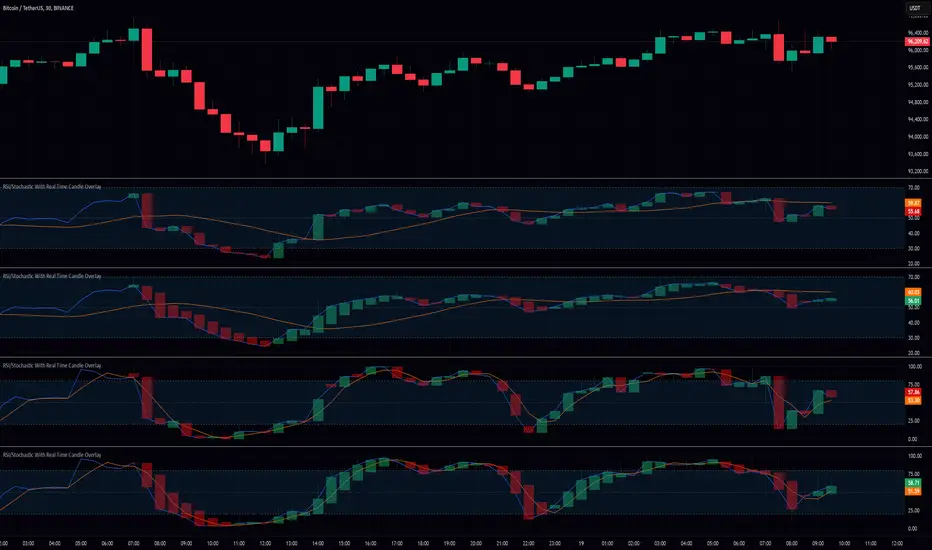
This indicator provides an alternative way to visualize either RSI or Stochastic values by representing them as candle bars in real time, allowing a more detailed view of momentum shifts within each bar. By default, it displays the standard historical plot of the chosen oscillator in the background, but once you are receiving real-time data (or if you keep your chart open through the close), it begins overlaying candles that track the oscillator’s intrabar movements. These candles only exist for as long as the chart remains open; if you refresh or load the chart anew, there is no stored candle history, although the standard RSI or Stochastic line is still fully retained. These candles offer insight into short-term fluctuations that are otherwise hidden when viewing a single line for RSI or Stochastic.
In the settings, there is an option to switch between standard candlesticks and Heiken Ashi. When Heiken Ashi is selected, the indicator uses the Heiken Ashi close once it updates in real time, producing a smoothed view of intrabar price movement for the oscillator. This can help identify trends in RSI or Stochastic by making it easier to spot subtle changes in direction, though some may prefer the unmodified values that come from using regular candles. The combination of these candle styles with an oscillator’s output offers flexibility for different analytical preferences.
Traders who use RSI or Stochastic often focus on entry and exit signals derived from crossing certain thresholds, but they are usually limited to a single reading per bar. With this tool, it becomes possible to watch how the oscillator’s value evolves within the bar itself, which can be especially useful for shorter timeframes or for those who prefer a more granular look at momentum shifts. The visual separation between bullish and bearish candle bodies within the indicator can highlight sudden reversals or confirm ongoing trends in the oscillator, aiding in more precise decision-making. Because the candle overlay is cleared as soon as the bar closes, the chart remains uncluttered when scrolling through historical data, ensuring that only the necessary real-time candle information is displayed.
Overall, this indicator is intended for users who wish to track intrabar changes in RSI or Stochastic, with the added choice of standard or Heiken Ashi candle representation. The real-time candle overlay clarifies short-lived fluctuations, while the standard line plots maintain the usual clarity of past data. This approach can be beneficial for those who want deeper insights into how oscillator values develop in real time, without permanently altering the simplicity of the chart’s historical view.
版本注释
Implemented the library 
Added an option to use an external input so that you can utilize this on anything.
版本注释
I forgot to set the display settings for the center line when using external inputs lol. Fixed.开源脚本
秉承TradingView的精神,该脚本的作者将其开源,以便交易者可以查看和验证其功能。向作者致敬!您可以免费使用该脚本,但请记住,重新发布代码须遵守我们的网站规则。
免责声明
这些信息和出版物并非旨在提供,也不构成TradingView提供或认可的任何形式的财务、投资、交易或其他类型的建议或推荐。请阅读使用条款了解更多信息。
开源脚本
秉承TradingView的精神,该脚本的作者将其开源,以便交易者可以查看和验证其功能。向作者致敬!您可以免费使用该脚本,但请记住,重新发布代码须遵守我们的网站规则。
免责声明
这些信息和出版物并非旨在提供,也不构成TradingView提供或认可的任何形式的财务、投资、交易或其他类型的建议或推荐。请阅读使用条款了解更多信息。