PROTECTED SOURCE SCRIPT
My_EMA_Trend v. 6.1
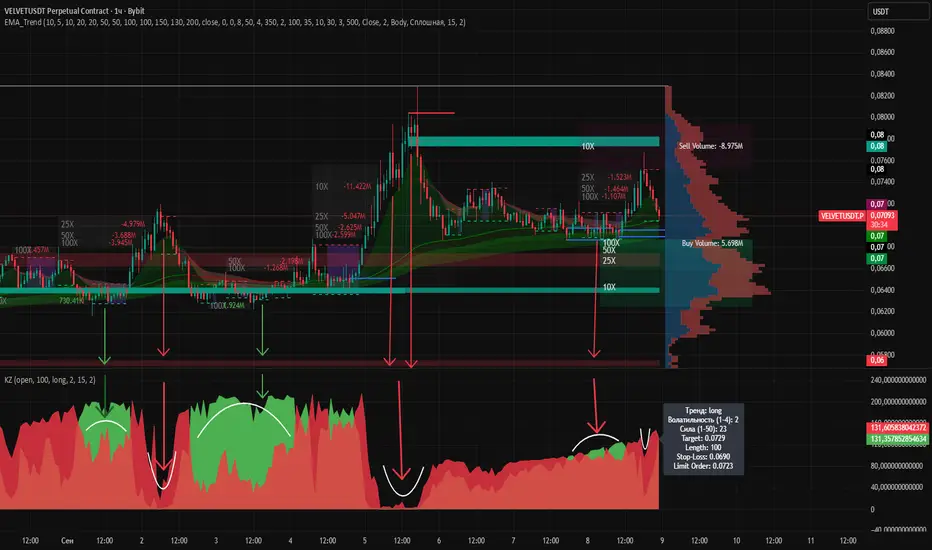
This script is a comprehensive trading indicator that includes several functional modules. Here is a brief description of its main functions:
Consolidation Zones
Detects and displays consolidation zones on the chart
Marks price accumulation areas
Generates breakout alerts (up/down)
Allows customization of analysis period and minimum consolidation length
EMA Clouds
Contains 5 sets of EMA clouds with different periods
Each cloud consists of short and long EMAs
Displays 10 exponential moving averages
Cloud colors change depending on trend direction
Customizable periods and visual parameters
Support/Resistance Levels
Automatically detects key levels
Uses ATR to calculate distances
Draws support and resistance zones
Has a function to extend recent levels
Customizable color schemes
Volume Indicator
Shows volume distribution across price levels
Visualizes buying and selling volume
Displays Point of Control (PoC)
Customizable number of histograms
Adjustable display width
Liquidation Zones
Identifies potential areas of mass position liquidations
Displays levels with different multipliers (10x, 25x, 50x, 100x)
Shows position volume
Includes a heatmap feature
Option to extend displayed zones
The script provides traders with a comprehensive set of tools for market analysis, including technical analysis, volume analysis, and key level identification. All components can be customized to meet individual user needs.
Best usage with my KZ
https://www.tradingview.com/x/gtp3hGoI/
受保护脚本
此脚本以闭源形式发布。 但是,您可以自由使用它,没有任何限制 — 在此处了解更多信息。
免责声明
这些信息和出版物并不意味着也不构成TradingView提供或认可的金融、投资、交易或其它类型的建议或背书。请在使用条款阅读更多信息。
免责声明
这些信息和出版物并不意味着也不构成TradingView提供或认可的金融、投资、交易或其它类型的建议或背书。请在使用条款阅读更多信息。