INVITE-ONLY SCRIPT
已更新 RSI-2
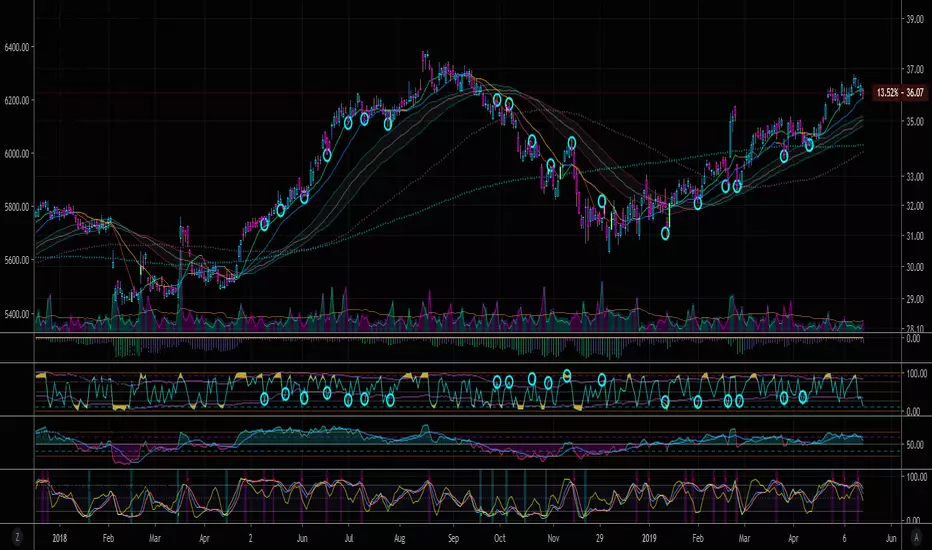
RSI-2 is an RSI indicator based on 2 periods.
It is used to locate pull back points within a major trend.
These points will generally offer the best risk/reward entry areas.
OB is >90
OS is <10
In an uptrend, long, when RSI-2 is OS
In a downtrend, short, when RSI-2 is OB
Start with 1D chart,
If RSI-2 gives too many signals (false signals) then use higher time frame, such as 3D
If RSi-2 gives not enough signals, then use a lower time frame, such as 3HR
For more information on RSI-2, read "Short term trading strategies that work"-by larry connors, chapter 9
版本注释
Updated version.Bollinger bands activated, to fix the prior issue where RSI-2 indicator was not sensitive enough on the current time frame to reach OS (<10) & OB (>90) areas.
With the bolinger bands, it effectively creates a corridor channel to use as OB & OS.
Bolinger band for RSI-2 uses 1 std dev over 31 periods.
traditional bolinger bands are based on: 2 std dev over 20 period ,
tradition TDI is based on: 1.618 std dev over 31 peroids
版本注释
update版本注释
update版本注释
update版本注释
update版本注释
update仅限邀请脚本
只有作者授权的用户才能访问此脚本。您需要申请并获得使用许可。通常情况下,付款后即可获得许可。更多详情,请按照下方作者的说明操作,或直接联系provalesco。
TradingView不建议您付费购买或使用任何脚本,除非您完全信任其作者并了解其工作原理。您也可以在我们的社区脚本找到免费的开源替代方案。
作者的说明
免责声明
这些信息和出版物并非旨在提供,也不构成TradingView提供或认可的任何形式的财务、投资、交易或其他类型的建议或推荐。请阅读使用条款了解更多信息。
仅限邀请脚本
只有作者授权的用户才能访问此脚本。您需要申请并获得使用许可。通常情况下,付款后即可获得许可。更多详情,请按照下方作者的说明操作,或直接联系provalesco。
TradingView不建议您付费购买或使用任何脚本,除非您完全信任其作者并了解其工作原理。您也可以在我们的社区脚本找到免费的开源替代方案。
作者的说明
免责声明
这些信息和出版物并非旨在提供,也不构成TradingView提供或认可的任何形式的财务、投资、交易或其他类型的建议或推荐。请阅读使用条款了解更多信息。