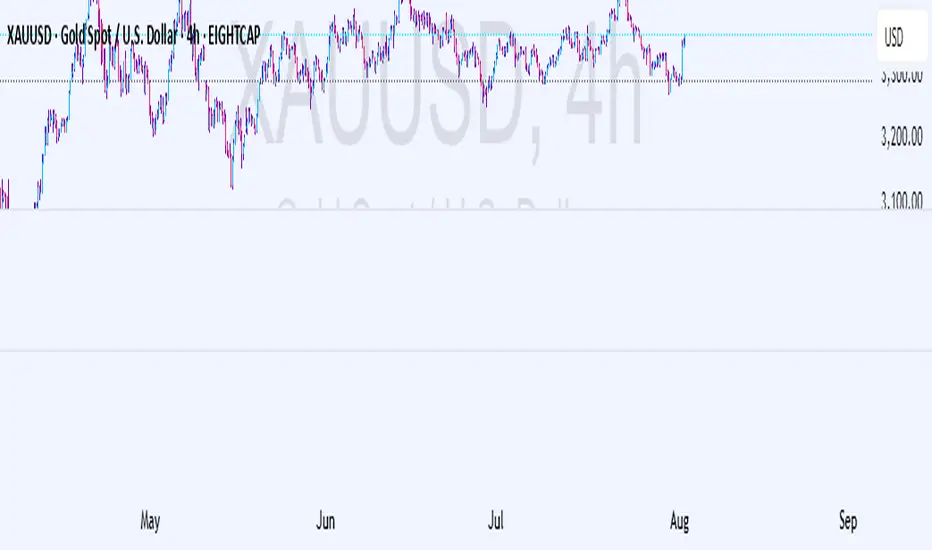
PROTECTED SOURCE SCRIPT
GOXXIE H4 S/R + Volume Zones + Alerts [For GOLD Day Traders]

This advanced indicator identifies key trading levels by combining:
H4 Timeframe Support/Resistance
Automatically detects swing highs/lows from the 4-hour chart
Plots them on your current timeframe (perfect for day traders)
Only shows confirmed levels (adjustable from 1-5 touches)
Volume Confirmation
Highlights high-volume zones from the H4 timeframe
Purple shading shows where institutions traded actively
Proximity Alerts
Customizable alerts when price approaches key levels (0.1%-5% distance)
Prevents missed opportunities at critical zones
Key Features:
✅ Multi-Timeframe Analysis - See H4 structure while trading lower timeframes
✅ Volume-Filtered Levels - Avoid false breaks with volume confirmation
✅ Customizable Sensitivity - Adjust touch requirements and alert distances
✅ Clean Visualization - Dashed lines (red=resistance, green=support) with subtle volume shading
Ideal For:
Day traders who need to align with higher timeframe structure
Swing traders looking for confluent support/resistance zones
Breakout/Reversal strategies with volume confirmation
Input Parameters:
Higher Timeframe (H4) - Base timeframe for level detection
Min Touches - How many times a level must be tested (1-5)
Volume Threshold - Sensitivity for high-volume zones (0.1-2.0)
Alert Distance - How close price must be to trigger alerts (0.1%-5%)
Pro Tips:
Combine with:
Trend confirmation (e.g., 200 EMA)
Candlestick patterns at key levels
Strongest signals occur when:
Price tests H4 level + volume zone simultaneously
Lower timeframe shows rejection (wick) or breakout (close beyond level)
Publishing Notes:
Categories: Strategy > Support/Resistance > Volume
Tags: support, resistance, volume, daytrading, multitimeframe
Preview Image: Show a chart with:
H4 levels on a 15m chart
Purple volume zones
Example alerts popping up
受保护脚本
此脚本以闭源形式发布。 但是,您可以自由使用它,没有任何限制 — 在此处了解更多信息。
免责声明
这些信息和出版物并不意味着也不构成TradingView提供或认可的金融、投资、交易或其它类型的建议或背书。请在使用条款阅读更多信息。
受保护脚本
此脚本以闭源形式发布。 但是,您可以自由使用它,没有任何限制 — 在此处了解更多信息。
免责声明
这些信息和出版物并不意味着也不构成TradingView提供或认可的金融、投资、交易或其它类型的建议或背书。请在使用条款阅读更多信息。