OPEN-SOURCE SCRIPT
已更新 Bollinger Bands %B + RSI
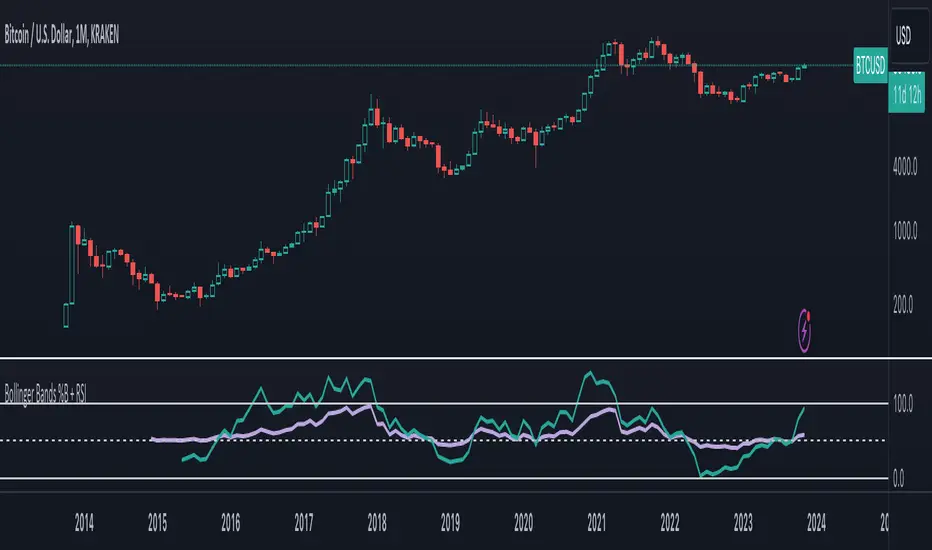
Bollinger Bands %b and RSI in one, and a experimental RSI cloud based in BB formula.
RSI scale goes from 0.00-1.00 instead of 0 -100.
RSI scale goes from 0.00-1.00 instead of 0 -100.
版本注释
Changes settings to default values of original (RSi 14 periods and bb%b 20 periods).Added a subtile color change on bb%b when Stochastic do crossovers.
Changed values from 0-1 to 0-100, where bb%b over 100 is outside upper band and under 0 is outside lower band.
版本注释
Fixed z-index on plots.Added stochastic color changes to rsi.
版本注释
And now Hull MA crossover indications on bb%b (the teal line).The RSI show stochastic crossover (the purple line).
Strong color indicates upwards trend.
Pale color indicates downwards trend.
版本注释
This is to abstract, so moving onwards with these two indicators:

Will update if i find a good way to merge them again.
版本注释
Added Hull.版本注释
Updated script to Pinescript version 5.开源脚本
秉承TradingView的精神,该脚本的作者将其开源,以便交易者可以查看和验证其功能。向作者致敬!您可以免费使用该脚本,但请记住,重新发布代码须遵守我们的网站规则。
免责声明
这些信息和出版物并非旨在提供,也不构成TradingView提供或认可的任何形式的财务、投资、交易或其他类型的建议或推荐。请阅读使用条款了解更多信息。
免责声明
这些信息和出版物并非旨在提供,也不构成TradingView提供或认可的任何形式的财务、投资、交易或其他类型的建议或推荐。请阅读使用条款了解更多信息。