OPEN-SOURCE SCRIPT
已更新 Panoramic EMA - Multi Timeframe
Panoramic EMA - Multi Timeframe
This indicator provides a straightforward visualization of Exponential Moving Averages (EMAs) from multiple timeframes simultaneously. This indicator allows traders to customize the display of EMAs, making it easier to identify and analyze trends and potential support or resistance levels across different periods.
Settings:
EMA Lengths: Customize up to five EMA lengths. Activating a length will display its EMA line on the chart for the selected timeframes.
Timeframes Selection: Choose up to four different timeframes to display the EMAs. This lets you observe how EMAs behave on various scales from a single chart.
Interpretation:
Utilize the EMAs as potential zones of dynamic support or resistance.
Observe the relationship between price action and EMAs across different timeframes to gauge market sentiment and identify trend consistency or potential shifts.
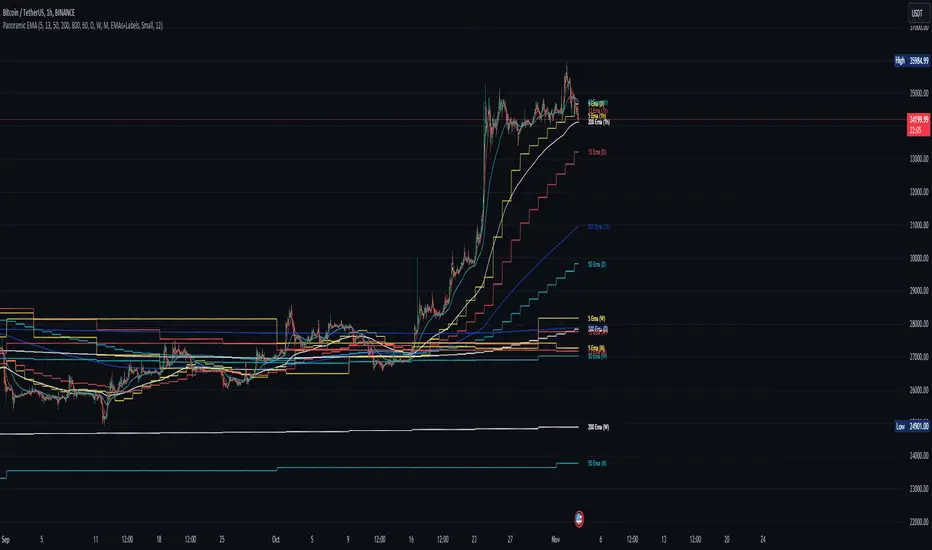
This tool is designed to offer visual clues about the market state through the behavior of EMAs. It does not generate direct buy or sell signals. It is recommended to understand how the assets you are trading interact with EMAs. For instance, in our example below, Bitcoin demonstrates a tendency to interact with the 800 and 200-length EMAs on the 4-hour timeframe, providing areas where price rejections may occur:

Note: This is a utility-focused indicator meant to supplement your market analysis and should be used in conjunction with other analysis methods or indicators for the best results.
This indicator provides a straightforward visualization of Exponential Moving Averages (EMAs) from multiple timeframes simultaneously. This indicator allows traders to customize the display of EMAs, making it easier to identify and analyze trends and potential support or resistance levels across different periods.
Settings:
EMA Lengths: Customize up to five EMA lengths. Activating a length will display its EMA line on the chart for the selected timeframes.
Timeframes Selection: Choose up to four different timeframes to display the EMAs. This lets you observe how EMAs behave on various scales from a single chart.
Interpretation:
Utilize the EMAs as potential zones of dynamic support or resistance.
Observe the relationship between price action and EMAs across different timeframes to gauge market sentiment and identify trend consistency or potential shifts.
This tool is designed to offer visual clues about the market state through the behavior of EMAs. It does not generate direct buy or sell signals. It is recommended to understand how the assets you are trading interact with EMAs. For instance, in our example below, Bitcoin demonstrates a tendency to interact with the 800 and 200-length EMAs on the 4-hour timeframe, providing areas where price rejections may occur:
Note: This is a utility-focused indicator meant to supplement your market analysis and should be used in conjunction with other analysis methods or indicators for the best results.
版本注释
- Added support for different MA types
版本注释
- Fill empty parenthesis on current timeframe with 'CTF'
开源脚本
秉承TradingView的精神,该脚本的作者将其开源,以便交易者可以查看和验证其功能。向作者致敬!您可以免费使用该脚本,但请记住,重新发布代码须遵守我们的网站规则。
Get access to our indicators at: huntergatherers.tech
免责声明
这些信息和出版物并非旨在提供,也不构成TradingView提供或认可的任何形式的财务、投资、交易或其他类型的建议或推荐。请阅读使用条款了解更多信息。
开源脚本
秉承TradingView的精神,该脚本的作者将其开源,以便交易者可以查看和验证其功能。向作者致敬!您可以免费使用该脚本,但请记住,重新发布代码须遵守我们的网站规则。
Get access to our indicators at: huntergatherers.tech
免责声明
这些信息和出版物并非旨在提供,也不构成TradingView提供或认可的任何形式的财务、投资、交易或其他类型的建议或推荐。请阅读使用条款了解更多信息。