INVITE-ONLY SCRIPT
已更新 Global Risk Matrix [QuantAlgo]
🟢 Overview
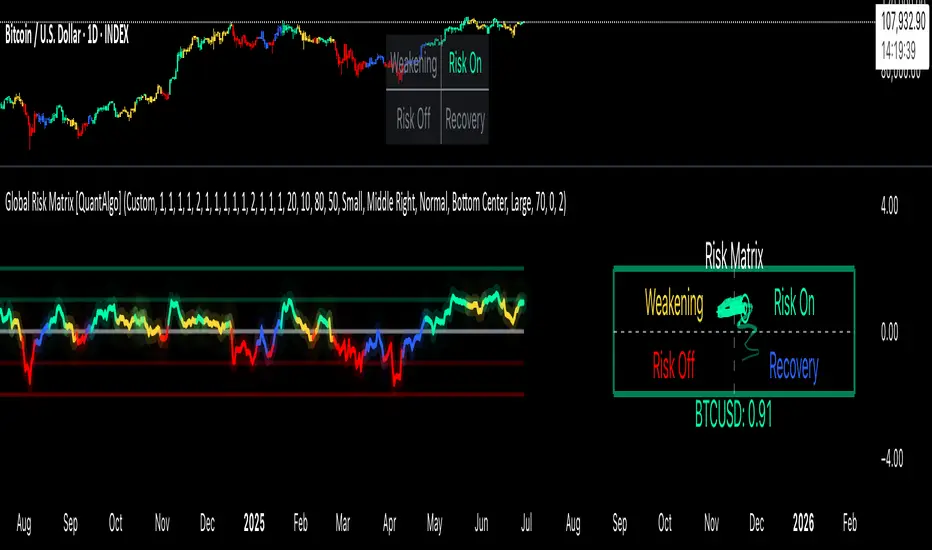
The Global Risk Matrix is a comprehensive macro risk assessment tool that aggregates multiple global financial indicators into a unified risk sentiment framework. It transforms diverse economic data streams (from currency strength and liquidity measures to volatility indices and commodity prices) into standardized Z-Score readings to identify market regime shifts across risk-on and risk-off conditions.

The indicator displays both a risk oscillator showing weighted average sentiment and a dynamic 2D matrix visualization that plots signal strength against momentum to reveal current market phase and historical evolution. This helps traders and investors understand broad market conditions, identify regime transitions, and align their strategies with prevailing macro risk environments across all asset classes.
🟢 How It Works
The indicator employs Z-Score normalization across various global macro components, each representing distinct aspects of market liquidity, sentiment, and economic health. Raw data from sources like DXY, S&P 500, Fed liquidity, global M2 money supply, VIX, and commodities undergoes statistical standardization. Several components are inverted (USDT.D, DXY, VIX, credit spreads, treasury bonds, gold) to align with risk-on interpretation, where positive values indicate bullish conditions.

This unique system applies configurable weights to each component based on selected asset class presets (Crypto Investor/Trader, Stock Trader, Commodity Trader, Forex Trader, Risk Parity, or Custom), creating a weighted average Z-Score. It then analyzes both signal strength and momentum direction to classify market conditions into four distinct phases: Risk-On (positive signal, rising momentum), Risk-Off (negative signal, falling momentum), Recovery (negative signal, rising momentum), and Weakening (positive signal, falling momentum). The 2D matrix visualization plots these dimensions with historical trail tracking to show regime evolution over time.
🟢 How to Use
1. Risk Oscillator Interpretation and Phase Analysis
2. Risk Matrix Visualization and Trail Analysis

3. Pro Tips for Trading and Investing
→ Portfolio Allocation Filter: Use Risk-On phases to increase exposure to growth assets, small caps, and emerging markets while reducing defensive positions during confirmed green phases
→ Entry Timing Enhancement: Combine Recovery phase signals with your technical analysis for optimal long entry points when macro headwinds are clearing but prices haven't fully recovered
→ Risk Management Overlay: Treat Weakening phase transitions as early warning systems to tighten stop losses, reduce position sizes, or hedge existing positions before full Risk-Off conditions develop
→ Sector Rotation Strategy: During Risk-On periods, favor cyclical sectors (technology, consumer discretionary, financials) while Risk-Off phases favor defensive sectors (utilities, consumer staples, healthcare)
→ Multi-Timeframe Confluence: Use daily matrix readings for strategic positioning while applying your regular technical analysis on lower timeframes for precise entry and exit execution
→ Divergence Detection: Watch for situations where your asset shows bullish technical patterns while the matrix shows Risk-Off conditions—these often provide the highest probability short opportunities and vice versa
The Global Risk Matrix is a comprehensive macro risk assessment tool that aggregates multiple global financial indicators into a unified risk sentiment framework. It transforms diverse economic data streams (from currency strength and liquidity measures to volatility indices and commodity prices) into standardized Z-Score readings to identify market regime shifts across risk-on and risk-off conditions.
The indicator displays both a risk oscillator showing weighted average sentiment and a dynamic 2D matrix visualization that plots signal strength against momentum to reveal current market phase and historical evolution. This helps traders and investors understand broad market conditions, identify regime transitions, and align their strategies with prevailing macro risk environments across all asset classes.
🟢 How It Works
The indicator employs Z-Score normalization across various global macro components, each representing distinct aspects of market liquidity, sentiment, and economic health. Raw data from sources like DXY, S&P 500, Fed liquidity, global M2 money supply, VIX, and commodities undergoes statistical standardization. Several components are inverted (USDT.D, DXY, VIX, credit spreads, treasury bonds, gold) to align with risk-on interpretation, where positive values indicate bullish conditions.
This unique system applies configurable weights to each component based on selected asset class presets (Crypto Investor/Trader, Stock Trader, Commodity Trader, Forex Trader, Risk Parity, or Custom), creating a weighted average Z-Score. It then analyzes both signal strength and momentum direction to classify market conditions into four distinct phases: Risk-On (positive signal, rising momentum), Risk-Off (negative signal, falling momentum), Recovery (negative signal, rising momentum), and Weakening (positive signal, falling momentum). The 2D matrix visualization plots these dimensions with historical trail tracking to show regime evolution over time.
🟢 How to Use
1. Risk Oscillator Interpretation and Phase Analysis
- Positive Territory (Above Zero): Indicates risk-on conditions with capital flowing toward growth assets and higher risk tolerance
- Negative Territory (Below Zero): Signals risk-off sentiment with capital seeking safety and defensive positioning
- Extreme Levels (±2.0): Represent statistically significant deviations that often precede regime reversals or trend exhaustion
- Zero Line Crosses: Mark critical transitions between risk regimes, providing early signals for portfolio rebalancing
- Phase Color Coding: Green (Risk-On), Red (Risk-Off), Blue (Recovery), Yellow (Weakening) for immediate regime identification
2. Risk Matrix Visualization and Trail Analysis
- Current Position Marker (⌾): Shows real-time location in the risk/momentum space for immediate situational awareness
- Historical Trail: Connected path showing recent market evolution and regime transition patterns
- Quadrant Analysis: Risk-On (upper right), Risk-Off (lower left), Recovery (lower right), Weakening (upper left)
- Trail Patterns: Clockwise rotation typically indicates healthy regime cycles, while erratic movement suggests uncertainty
3. Pro Tips for Trading and Investing
→ Portfolio Allocation Filter: Use Risk-On phases to increase exposure to growth assets, small caps, and emerging markets while reducing defensive positions during confirmed green phases
→ Entry Timing Enhancement: Combine Recovery phase signals with your technical analysis for optimal long entry points when macro headwinds are clearing but prices haven't fully recovered
→ Risk Management Overlay: Treat Weakening phase transitions as early warning systems to tighten stop losses, reduce position sizes, or hedge existing positions before full Risk-Off conditions develop
→ Sector Rotation Strategy: During Risk-On periods, favor cyclical sectors (technology, consumer discretionary, financials) while Risk-Off phases favor defensive sectors (utilities, consumer staples, healthcare)
→ Multi-Timeframe Confluence: Use daily matrix readings for strategic positioning while applying your regular technical analysis on lower timeframes for precise entry and exit execution
→ Divergence Detection: Watch for situations where your asset shows bullish technical patterns while the matrix shows Risk-Off conditions—these often provide the highest probability short opportunities and vice versa
版本注释
Updated UI版本注释
Updated alerts版本注释
Updated M2 ticker仅限邀请脚本
只有作者授权的用户才能访问此脚本。您需要申请并获得使用许可。通常情况下,付款后即可获得许可。更多详情,请按照下方作者的说明操作,或直接联系QuantAlgo。
TradingView不建议您付费购买或使用任何脚本,除非您完全信任其作者并了解其工作原理。您也可以在我们的社区脚本找到免费的开源替代方案。
作者的说明
🚨 Use code PREMIUM50 for 50% off. Offer ends soon: https://whop.com/quantalgo/
👉 Access our best trading & investing tools here (3-day FREE trial): whop.com/quantalgo/
免责声明
这些信息和出版物并非旨在提供,也不构成TradingView提供或认可的任何形式的财务、投资、交易或其他类型的建议或推荐。请阅读使用条款了解更多信息。
仅限邀请脚本
只有作者授权的用户才能访问此脚本。您需要申请并获得使用许可。通常情况下,付款后即可获得许可。更多详情,请按照下方作者的说明操作,或直接联系QuantAlgo。
TradingView不建议您付费购买或使用任何脚本,除非您完全信任其作者并了解其工作原理。您也可以在我们的社区脚本找到免费的开源替代方案。
作者的说明
🚨 Use code PREMIUM50 for 50% off. Offer ends soon: https://whop.com/quantalgo/
👉 Access our best trading & investing tools here (3-day FREE trial): whop.com/quantalgo/
免责声明
这些信息和出版物并非旨在提供,也不构成TradingView提供或认可的任何形式的财务、投资、交易或其他类型的建议或推荐。请阅读使用条款了解更多信息。