OPEN-SOURCE SCRIPT
Highs and Lows Marker
Indicator Description – Highs and Lows Marker
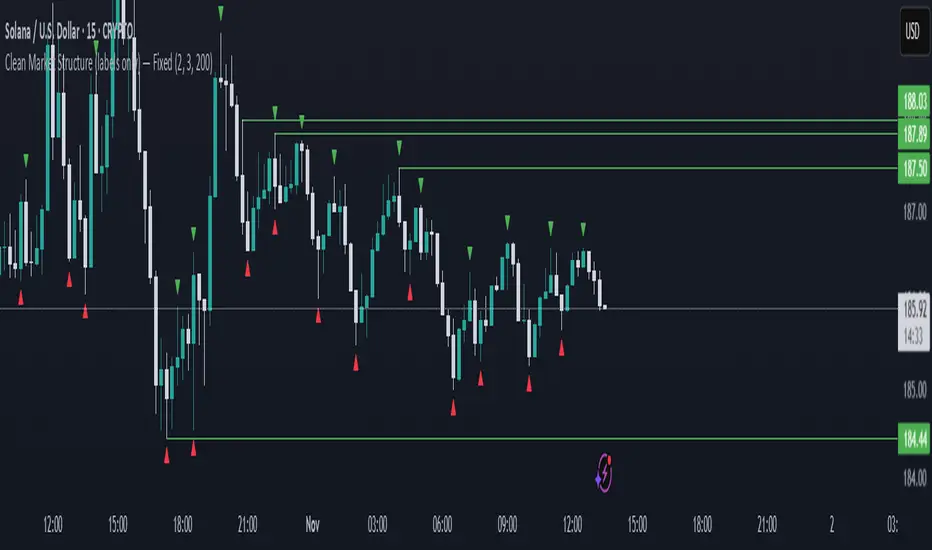
This indicator identifies swing highs and swing lows based on a simple two-candle pattern structure:
High Formation (Swing High):
A High is marked when a bullish candle (Candle Up) is immediately followed by a bearish candle (Candle Down).
The High value is taken as the highest wick price between the two candles in this formation.
This represents a potential short-term resistance or turning point in the market.
Low Formation (Swing Low):
A Low is marked when a bearish candle (Candle Down) is immediately followed by a bullish candle (Candle Up).
The Low value is taken as the lowest wick price between the two candles in this formation.
This represents a potential short-term support or reversal area.
开源脚本
秉承TradingView的精神,该脚本的作者将其开源,以便交易者可以查看和验证其功能。向作者致敬!您可以免费使用该脚本,但请记住,重新发布代码须遵守我们的网站规则。
免责声明
这些信息和出版物并非旨在提供,也不构成TradingView提供或认可的任何形式的财务、投资、交易或其他类型的建议或推荐。请阅读使用条款了解更多信息。
开源脚本
秉承TradingView的精神,该脚本的作者将其开源,以便交易者可以查看和验证其功能。向作者致敬!您可以免费使用该脚本,但请记住,重新发布代码须遵守我们的网站规则。
免责声明
这些信息和出版物并非旨在提供,也不构成TradingView提供或认可的任何形式的财务、投资、交易或其他类型的建议或推荐。请阅读使用条款了解更多信息。