OPEN-SOURCE SCRIPT
已更新 Futures Correlation Visualizer

OVERVIEW
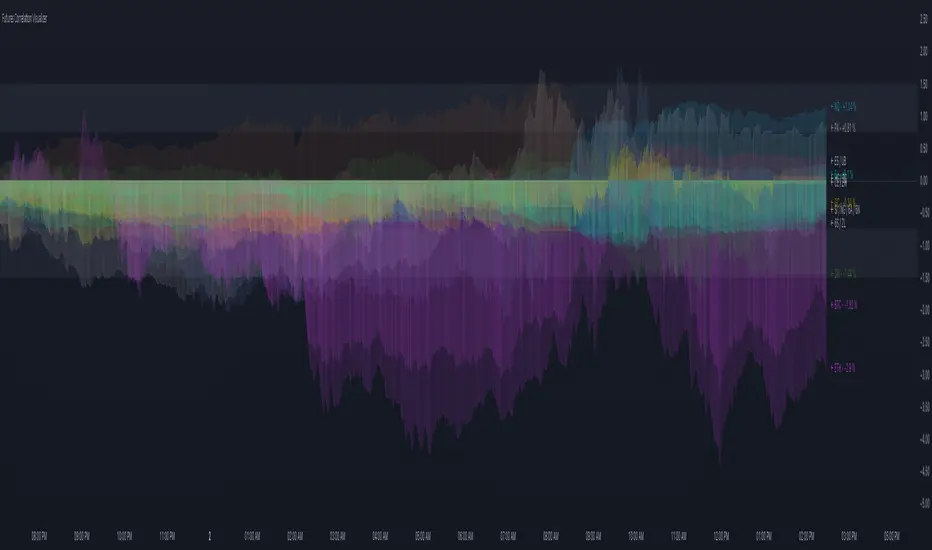
This indicator plots the normalized price changes of commonly traded futures. Visualizing data in this way makes studying and understanding market participation and sentiment easier.
Note:
Only 20 symbols can be plotted. The "request" functions are limited to 40 calls, 1 timeframe counts as a call, and 2 timeframes are used per symbol. Normalized values are derived by dividing the charts timeframe by 1D data. A runtime error will occur when more than 20 symbols are enabled. This limitation is unavoidable.
INPUTS
You can configure:
- Colors and color scheme
- Symbols to plot (most common futures)
- Norm. source (todays open / yesterdays close)
- Measurement type (%, ‱, Δ)
- Label, zone, and zero options
版本注释
- Added link to indicator page the top of the code.
- Updated chart
版本注释
- Minor code changes.
- Added "Smooth" option for color transitions.
- Converted to Pine Script v6
版本注释
- Updated script to align with Pine Script changes: Pine Script recently updated when loop boundaries were checked. Previously, the boundary was established before iterating. Now, the boundary is evaluated on each iteration.
版本注释
- Improved logic to be more reliable after partial trading days.
开源脚本
秉承TradingView的精神,该脚本的作者将其开源,以便交易者可以查看和验证其功能。向作者致敬!您可以免费使用该脚本,但请记住,重新发布代码须遵守我们的网站规则。
Discord: discord.gg/bPAPhwUeud
Website: liquid-trader.com
Website: liquid-trader.com
免责声明
这些信息和出版物并非旨在提供,也不构成TradingView提供或认可的任何形式的财务、投资、交易或其他类型的建议或推荐。请阅读使用条款了解更多信息。
开源脚本
秉承TradingView的精神,该脚本的作者将其开源,以便交易者可以查看和验证其功能。向作者致敬!您可以免费使用该脚本,但请记住,重新发布代码须遵守我们的网站规则。
Discord: discord.gg/bPAPhwUeud
Website: liquid-trader.com
Website: liquid-trader.com
免责声明
这些信息和出版物并非旨在提供,也不构成TradingView提供或认可的任何形式的财务、投资、交易或其他类型的建议或推荐。请阅读使用条款了解更多信息。