PROTECTED SOURCE SCRIPT
Adaptive Open Interest
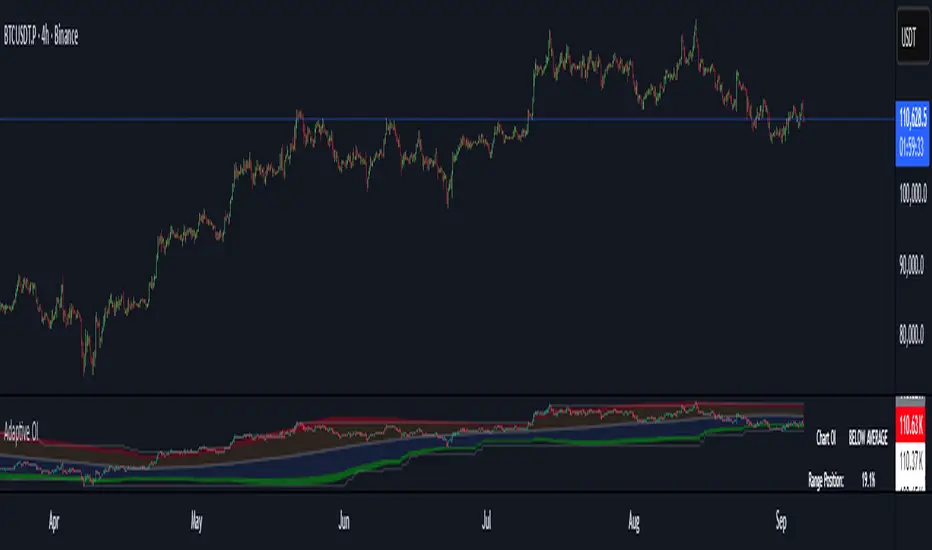
This indicator analyzes Bitcoin open interest to identify overbought and oversold conditions that historically precede major price moves. Unlike static levels, it automatically adapts to current market conditions by analyzing the last 320 bars (user adjustable).
How It Works
Adaptive Algorithm:
-Analyzes the last 320 bars of open interest data
-Combines percentile analysis (90th, 80th, 20th, 10th percentiles) with statistical analysis (standard deviations)
-Creates dynamic zones that adjust as market conditions change
Four Key Zones:
🔴 Extreme Overbought (Red) - Major crash risk territory
🟠 Overbought (Orange) - Correction risk territory
🔵 Oversold (Blue) - Opportunity territory
🟢 Extreme Oversold (Green) - Major opportunity territory
For Risk Management:
-When OI enters red zones → Consider reducing long positions, major crash risk
-When OI enters orange zones → Caution, correction likely incoming
For Opportunities:
-When OI enters blue zones → Look for long opportunities
-When OI enters green zones → Strong buying opportunity, major bounce potential
The Table Shows:
-Current status (which zone OI is in)
-Range position (where current OI sits as % of 320-bar range)
-320-bar high/low levels for context
Why It's Effective:
-Adaptive Nature: What's "high" OI in a bear market differs from bull market - the indicator knows the difference and adjusts automatically.
-Proven Approach: Combines multiple statistical methods for robust signals that work across different market cycles.
-Alert System: Optional alerts notify you when OI crosses critical thresholds, so you don't miss important signals.
-The indicator essentially tells you when the futures market is getting "too crowded" (danger) or "too empty" (opportunity) relative to recent history.
受保护脚本
此脚本以闭源形式发布。 但是,您可以自由使用,没有任何限制 — 了解更多信息这里。
免责声明
这些信息和出版物并非旨在提供,也不构成TradingView提供或认可的任何形式的财务、投资、交易或其他类型的建议或推荐。请阅读使用条款了解更多信息。
受保护脚本
此脚本以闭源形式发布。 但是,您可以自由使用,没有任何限制 — 了解更多信息这里。
免责声明
这些信息和出版物并非旨在提供,也不构成TradingView提供或认可的任何形式的财务、投资、交易或其他类型的建议或推荐。请阅读使用条款了解更多信息。