OPEN-SOURCE SCRIPT
Chart CAGR
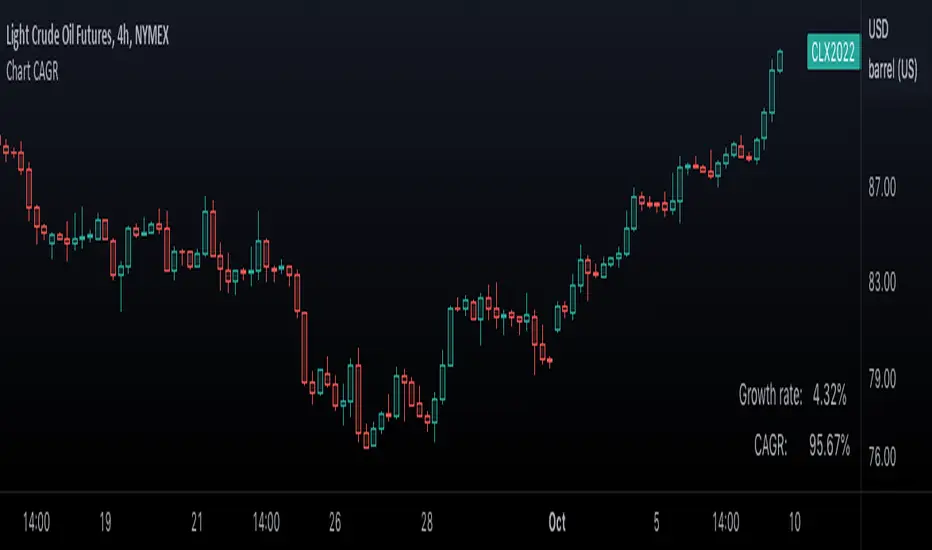
█ OVERVIEW
This simple script displays in the lower-right corner of the chart the Growth Rate and the Compound Annual Growth Rate (CAGR) between the open of the chart's first visible bar and the close of its last bar. As you zoom/scroll the chart, calculations will adjust to the chart's bars. You can change the location and colors of the displayed text in the script's settings.
If you need to calculate the CAGR between any two points on the chart, see our CAGR Custom Range indicator.
█ FOR Pine Script™ CODERS
Like our Chart VWAP publication, this script calculates on the range of visible bars utilizing the new Pine Script™ functions announced here and the VisibleChart library by PineCoders. It also uses the `cagr()` function from our ta library, which was recently augmented with many new functions.
Look first. Then leap.
开源脚本
秉承TradingView的精神,该脚本的作者将其开源,以便交易者可以查看和验证其功能。向作者致敬!您可以免费使用该脚本,但请记住,重新发布代码须遵守我们的网站规则。
Share TradingView with a friend:
tradingview.com/share-your-love/
Check out all #tradingviewtips
tradingview.com/ideas/tradingviewtips/?type=education
New Tools and Features:
tradingview.com/blog/en/
tradingview.com/share-your-love/
Check out all #tradingviewtips
tradingview.com/ideas/tradingviewtips/?type=education
New Tools and Features:
tradingview.com/blog/en/
免责声明
这些信息和出版物并非旨在提供,也不构成TradingView提供或认可的任何形式的财务、投资、交易或其他类型的建议或推荐。请阅读使用条款了解更多信息。