OPEN-SOURCE SCRIPT
Relative Volume Standard Deviation
The Relative Volume Standard Deviation indicator is a powerful tool designed for traders seeking insights into volume dynamics. This indicator assesses the deviation of a security's trading volume from its moving average, shedding light on potential shifts in market sentiment.
Key Features:
-Length: Tailor the indicator's sensitivity by adjusting the length of the moving average.
-Number of Deviations: Customize the analysis by specifying the number of standard deviations to consider.
-Show Negative Values: Toggle the visibility of negative values in the plot for a comprehensive view.
How it Works:
-Moving Average Calculation: The script computes the simple moving average (SMA) of the trading volume over the specified length, providing a baseline for comparison.
-Standard Deviation Analysis: It calculates the standard deviation of the volume, identifying deviations from the average volume.
-Relative Volume Standard Deviation: The indicator then normalizes the difference between the volume and its moving average by the calculated standard deviation, producing a relative measure of volume deviation.
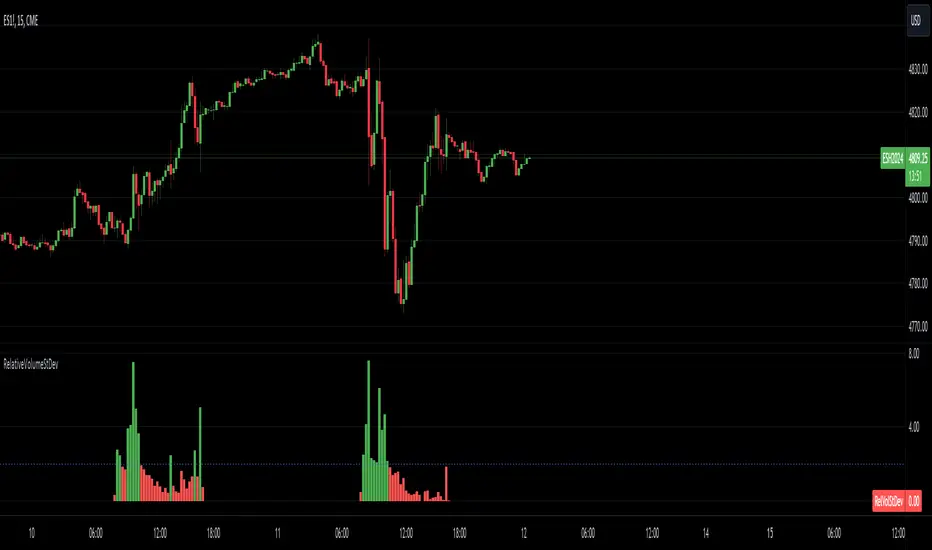
-Visual Representation: The result is visually represented on the chart using columns. Green columns signify relative volume standard deviation values greater than or equal to the specified number of deviations, while red columns represent values below this threshold.
-Enhancements:
Show Deviation Level: Optionally, a dashed horizontal line at the specified deviation level adds an extra layer of analysis, aiding in the identification of significant deviations.
Key Features:
-Length: Tailor the indicator's sensitivity by adjusting the length of the moving average.
-Number of Deviations: Customize the analysis by specifying the number of standard deviations to consider.
-Show Negative Values: Toggle the visibility of negative values in the plot for a comprehensive view.
How it Works:
-Moving Average Calculation: The script computes the simple moving average (SMA) of the trading volume over the specified length, providing a baseline for comparison.
-Standard Deviation Analysis: It calculates the standard deviation of the volume, identifying deviations from the average volume.
-Relative Volume Standard Deviation: The indicator then normalizes the difference between the volume and its moving average by the calculated standard deviation, producing a relative measure of volume deviation.
-Visual Representation: The result is visually represented on the chart using columns. Green columns signify relative volume standard deviation values greater than or equal to the specified number of deviations, while red columns represent values below this threshold.
-Enhancements:
Show Deviation Level: Optionally, a dashed horizontal line at the specified deviation level adds an extra layer of analysis, aiding in the identification of significant deviations.
开源脚本
秉承TradingView的精神,该脚本的作者将其开源,以便交易者可以查看和验证其功能。向作者致敬!您可以免费使用该脚本,但请记住,重新发布代码须遵守我们的网站规则。
免责声明
这些信息和出版物并非旨在提供,也不构成TradingView提供或认可的任何形式的财务、投资、交易或其他类型的建议或推荐。请阅读使用条款了解更多信息。
开源脚本
秉承TradingView的精神,该脚本的作者将其开源,以便交易者可以查看和验证其功能。向作者致敬!您可以免费使用该脚本,但请记住,重新发布代码须遵守我们的网站规则。
免责声明
这些信息和出版物并非旨在提供,也不构成TradingView提供或认可的任何形式的财务、投资、交易或其他类型的建议或推荐。请阅读使用条款了解更多信息。