OPEN-SOURCE SCRIPT
已更新 POCs and VAHs VALs - All and Non-Broken
The "POC and VAH VAL - All and Non-Broken"
POC = Points of Control
VAH = Value Area High
VAL = Value Area Low
This indicator aims to show you on the 5 minute time frame all POCs and VAHs/VALs and Non-Broken POCs and VAHs/VALs.
(Non-Broken are POCS and VAHs/VALS where price action has not since crossed its path)
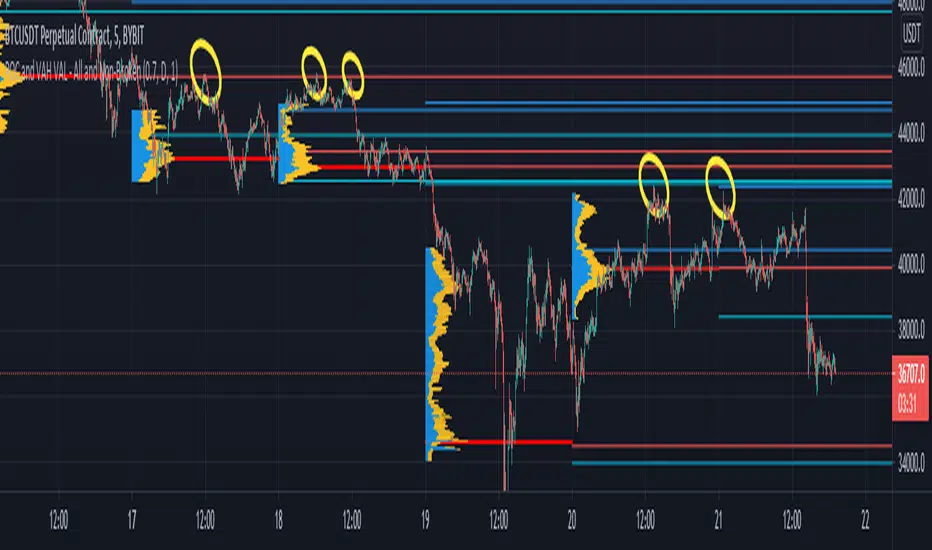
In the screen image above I have used VPVR to back test on BYBIT:BTCUSDT.
The POCs and VAHs/VALs for each day can be seen.
Also there is an option to see non-broken POCS and VAHs/VALs within the settings.
All display options are selectable within the settings.
The indicator is not as precise as using the VPVR but is a lot quicker and gives you a quick snapshot to assist with your technical analysis.
In the screen shot above are some examples highlighted with yellow circles (resistance at POC and VAHs/VALs).
Thanks goes to:
ahancock for use of his code.
Bjorn Mistiaen on StackOverFlow for his assistance.
Disclaimer:
Indicator has been coded to only show on 5 min time frame (after back testing seemed most accurate).
Only back tested on BYBIT:BTCUST.
There are some slight discrepancies.
Back tested against VPVR settings: Row Size 500, Value Area 70.
Maximum of 500 lines will only be shown.
POC = Points of Control
VAH = Value Area High
VAL = Value Area Low
This indicator aims to show you on the 5 minute time frame all POCs and VAHs/VALs and Non-Broken POCs and VAHs/VALs.
(Non-Broken are POCS and VAHs/VALS where price action has not since crossed its path)
In the screen image above I have used VPVR to back test on BYBIT:BTCUSDT.
The POCs and VAHs/VALs for each day can be seen.
Also there is an option to see non-broken POCS and VAHs/VALs within the settings.
All display options are selectable within the settings.
The indicator is not as precise as using the VPVR but is a lot quicker and gives you a quick snapshot to assist with your technical analysis.
In the screen shot above are some examples highlighted with yellow circles (resistance at POC and VAHs/VALs).
Thanks goes to:
ahancock for use of his code.
Bjorn Mistiaen on StackOverFlow for his assistance.
Disclaimer:
Indicator has been coded to only show on 5 min time frame (after back testing seemed most accurate).
Only back tested on BYBIT:BTCUST.
There are some slight discrepancies.
Back tested against VPVR settings: Row Size 500, Value Area 70.
Maximum of 500 lines will only be shown.
版本注释
User highlighted that only the unbroken POCs/VAHs/VALs below the current price were showing on the chart. Script has now been updated to show the unbroken above and below current price.
开源脚本
秉承TradingView的精神,该脚本的作者将其开源,以便交易者可以查看和验证其功能。向作者致敬!您可以免费使用该脚本,但请记住,重新发布代码须遵守我们的网站规则。
免责声明
这些信息和出版物并非旨在提供,也不构成TradingView提供或认可的任何形式的财务、投资、交易或其他类型的建议或推荐。请阅读使用条款了解更多信息。
开源脚本
秉承TradingView的精神,该脚本的作者将其开源,以便交易者可以查看和验证其功能。向作者致敬!您可以免费使用该脚本,但请记住,重新发布代码须遵守我们的网站规则。
免责声明
这些信息和出版物并非旨在提供,也不构成TradingView提供或认可的任何形式的财务、投资、交易或其他类型的建议或推荐。请阅读使用条款了解更多信息。