PROTECTED SOURCE SCRIPT
Sessions_X
📊 Session_x Indicator - Master Documentation
Overview
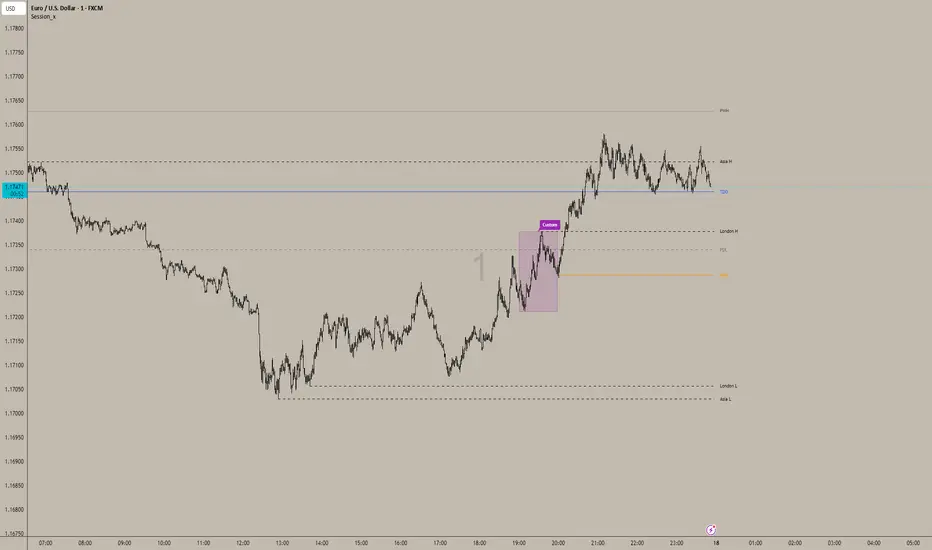
Session_x is a comprehensive ICT/SMC trading toolkit designed for precision intraday trading. It visualizes key session timings, liquidity levels (Highs/Lows), and institutional opening prices. The indicator features a "Smart History" system that keeps the current trading day clean with actionable lines, while converting previous days into visual boxes for back testing and review.
________________________________________
🌟 Key Features
1. 🕒 Session Logic (Current Day vs. History)
The indicator handles the Asian and London sessions dynamically to keep your chart clutter-free.
• Current Day (Live):
o Draws Lines representing the Session High and Low.
o Wick Precision: The lines start exactly from the candle wick that created the High or Low (not the session start time).
o Extensions: Lines extend to the right to act as live support/resistance.
o Labels: Clearly labelled (e.g., "Asia H", "London L") on the right side.
• Previous Days (History):
o Once the trading day closes (midnight), the lines are automatically deleted.
o They are replaced by a Shaded Box covering the session's range (High to Low, Start Time to End Time).
o Customizable: You can set separate styles (colors, borders) for the live lines and the history boxes.
2. 📦 Custom Time Box
A completely independent tool to track a specific time window (e.g., a "Silver Bullet" hour or a specific news window).
• Always a Box: Unlike Asia/London, this feature draws a box immediately when the time starts, both for the current day and history.
• Precision: Snaps exactly to the High and Low wicks within that time range.
3. 🔑 Institutional Levels
• TDO (True Day Open): Marks the opening price at 00:00 (NY Time). This line extends indefinitely throughout the current day to act as a bias filter.
• NYO (New York Open): Marks the opening price at 09:30 (NY Time). This line extends only for the current trading day and stops at the end of the day to prevent overlap.
4. 📈 High Timeframe Liquidity
• PDH / PDL (Previous Day High/Low): Dashed lines marking yesterday's range.
• PWH / PWL (Previous Week High/Low): Dotted lines marking the previous week's range.
• Note: These lines extend automatically and update at the start of a new day or week.
5. 🌊 EMA Ribbon
A trend-following tool consisting of 4 customizable Exponential Moving Averages.
• Defaults: 9, 20, 50, 200 lengths.
• Editable: You can toggle the ribbon on/off and change the Length, Colour, and Thickness of every individual EMA.
6. 🔔 Built-in Alerts
Automated alerts to notify you of key session breakouts:
• London Breakout: Triggers when price crosses the Asian Session High or Low during the London session.
• NY Breakout: Triggers when price crosses the London Session High or Low during the New York session.
________________________________________
⚙️ Settings Guide
You can access these settings by double-clicking the indicator on your chart.
1. Time zone & History
• Indicator Time zone: Default is America/New York. All session times below refer to this time zone.
• Days to Keep History: Controls how far back the boxes and lines appear (default is 3 days). Increase this to see more history, decrease it to improve chart performance.
2. Labels & Separators
• Show Names: Toggle text labels on/off.
• Text Colour/Size: Customize the look of the labels ("Asia H", "PDH", etc.).
• Day Separator: A vertical line drawn at 00:00 to visually separate trading days.
3. Session Settings (Asia / London)
• Time: Define the start and end time (e.g., 0200-0500).
• Current Day Lines: Controls the look of the active dashed lines.
• History Boxes: Controls the look of the shaded boxes that appear after the day finishes.
4. Custom Box
• Time: Set your custom time range (e.g., 1000-1100).
• Style: Controls the Border Colour, Width, and Background transparency.
5. Key Levels & HTF
• TDO / NYO: Enable/Disable and style the True Day Open and NY Open lines.
• PDH/PDL & PWH/PWL: Enable/Disable and style Previous Day/Week levels.
________________________________________
🚀 How to Trade with It
1. Bias Determination: Use the TDO line. If price is above TDO, look for longs. If below, look for shorts.
2. Liquidity Targets: Use PDH/PDL and PWH/PWL as major targets for take-profits.
3. Session Sweeps (Judas Swing):
o Watch for the London Session to sweep the Asian High/Low (Alert provided).
o Watch for the NY Session to sweep the London High/Low (Alert provided).
4. Trend: Use the EMA Ribbon. If the fast EMAs (9, 20) are above the slow EMAs (50, 200), the trend is bullish.
Overview
Session_x is a comprehensive ICT/SMC trading toolkit designed for precision intraday trading. It visualizes key session timings, liquidity levels (Highs/Lows), and institutional opening prices. The indicator features a "Smart History" system that keeps the current trading day clean with actionable lines, while converting previous days into visual boxes for back testing and review.
________________________________________
🌟 Key Features
1. 🕒 Session Logic (Current Day vs. History)
The indicator handles the Asian and London sessions dynamically to keep your chart clutter-free.
• Current Day (Live):
o Draws Lines representing the Session High and Low.
o Wick Precision: The lines start exactly from the candle wick that created the High or Low (not the session start time).
o Extensions: Lines extend to the right to act as live support/resistance.
o Labels: Clearly labelled (e.g., "Asia H", "London L") on the right side.
• Previous Days (History):
o Once the trading day closes (midnight), the lines are automatically deleted.
o They are replaced by a Shaded Box covering the session's range (High to Low, Start Time to End Time).
o Customizable: You can set separate styles (colors, borders) for the live lines and the history boxes.
2. 📦 Custom Time Box
A completely independent tool to track a specific time window (e.g., a "Silver Bullet" hour or a specific news window).
• Always a Box: Unlike Asia/London, this feature draws a box immediately when the time starts, both for the current day and history.
• Precision: Snaps exactly to the High and Low wicks within that time range.
3. 🔑 Institutional Levels
• TDO (True Day Open): Marks the opening price at 00:00 (NY Time). This line extends indefinitely throughout the current day to act as a bias filter.
• NYO (New York Open): Marks the opening price at 09:30 (NY Time). This line extends only for the current trading day and stops at the end of the day to prevent overlap.
4. 📈 High Timeframe Liquidity
• PDH / PDL (Previous Day High/Low): Dashed lines marking yesterday's range.
• PWH / PWL (Previous Week High/Low): Dotted lines marking the previous week's range.
• Note: These lines extend automatically and update at the start of a new day or week.
5. 🌊 EMA Ribbon
A trend-following tool consisting of 4 customizable Exponential Moving Averages.
• Defaults: 9, 20, 50, 200 lengths.
• Editable: You can toggle the ribbon on/off and change the Length, Colour, and Thickness of every individual EMA.
6. 🔔 Built-in Alerts
Automated alerts to notify you of key session breakouts:
• London Breakout: Triggers when price crosses the Asian Session High or Low during the London session.
• NY Breakout: Triggers when price crosses the London Session High or Low during the New York session.
________________________________________
⚙️ Settings Guide
You can access these settings by double-clicking the indicator on your chart.
1. Time zone & History
• Indicator Time zone: Default is America/New York. All session times below refer to this time zone.
• Days to Keep History: Controls how far back the boxes and lines appear (default is 3 days). Increase this to see more history, decrease it to improve chart performance.
2. Labels & Separators
• Show Names: Toggle text labels on/off.
• Text Colour/Size: Customize the look of the labels ("Asia H", "PDH", etc.).
• Day Separator: A vertical line drawn at 00:00 to visually separate trading days.
3. Session Settings (Asia / London)
• Time: Define the start and end time (e.g., 0200-0500).
• Current Day Lines: Controls the look of the active dashed lines.
• History Boxes: Controls the look of the shaded boxes that appear after the day finishes.
4. Custom Box
• Time: Set your custom time range (e.g., 1000-1100).
• Style: Controls the Border Colour, Width, and Background transparency.
5. Key Levels & HTF
• TDO / NYO: Enable/Disable and style the True Day Open and NY Open lines.
• PDH/PDL & PWH/PWL: Enable/Disable and style Previous Day/Week levels.
________________________________________
🚀 How to Trade with It
1. Bias Determination: Use the TDO line. If price is above TDO, look for longs. If below, look for shorts.
2. Liquidity Targets: Use PDH/PDL and PWH/PWL as major targets for take-profits.
3. Session Sweeps (Judas Swing):
o Watch for the London Session to sweep the Asian High/Low (Alert provided).
o Watch for the NY Session to sweep the London High/Low (Alert provided).
4. Trend: Use the EMA Ribbon. If the fast EMAs (9, 20) are above the slow EMAs (50, 200), the trend is bullish.
受保护脚本
此脚本以闭源形式发布。 但是,您可以自由使用,没有任何限制 — 了解更多信息这里。
免责声明
这些信息和出版物并非旨在提供,也不构成TradingView提供或认可的任何形式的财务、投资、交易或其他类型的建议或推荐。请阅读使用条款了解更多信息。
免责声明
这些信息和出版物并非旨在提供,也不构成TradingView提供或认可的任何形式的财务、投资、交易或其他类型的建议或推荐。请阅读使用条款了解更多信息。