OPEN-SOURCE SCRIPT
已更新 vol_box

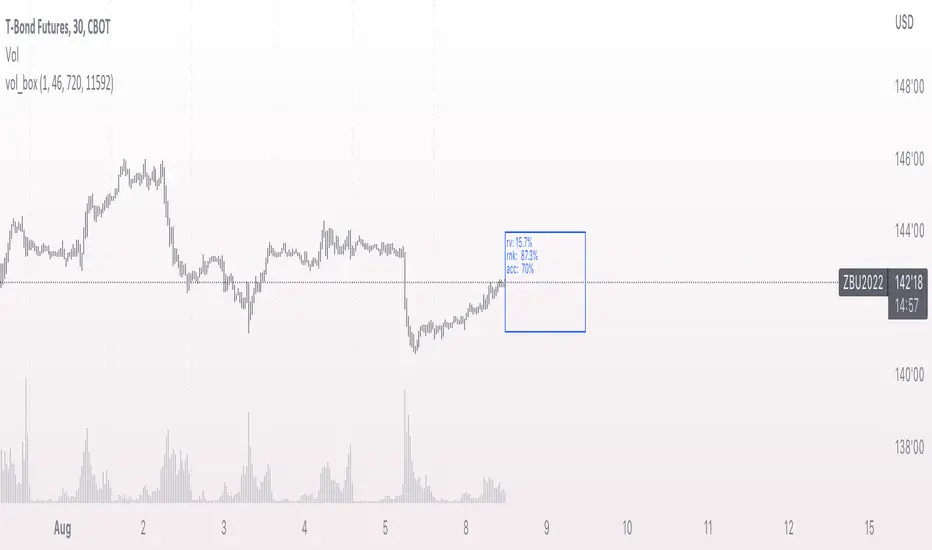
A simple script to draw a realized volatility forecast, in the form of a box. The script calculates realized volatility using the EWMA method, using a number of periods of your choosing. Using the "periods per year", you can adjust the script to work on any time frame. For example, if you are using an hourly chart with bitcoin, there are 24 periods * 365 = 8760 periods per year. This setting is essential for the realized volatility figure to be accurate as an annualized figure, like VIX.
By default, the settings are set to mimic CBOE volatility indices. That is, 252 days per year, and 20 period window on the daily timeframe (simulating a 30 trading day period).
Inside the box are three figures:
1. The current realized volatility.
2. The rank. E.g. "10%" means the current realized volatility is less than 90% of realized volatility measures.
3. The "accuracy": how often price has closed within the box, historically.
Inputs:
stdevs: the number of standard deviations for the box
periods to project: the number of periods to forecast
window: the number of periods for calculating realized volatility
periods per year: the number of periods in one year (e.g. 252 for the "D" timeframe)
版本注释
fixed rank版本注释
- abbreviated termsSome further settings examples:
Financial futures generally trade 23 hours a day. Grain futures trade about 18 hours a day. For a 30 minute chart, projecting 1 day in the future, with a 20 day window for calculating RV, use:
Financials:
periods to project: 46
window: 920
periods per year: 11592
grains:
periods to project: 36
window: 720
periods per year: 9072
版本注释
cleaned up some extraneous code版本注释
added historical projection lines. if the price closed outside the projection, the nearest bound is colored red. otherwise, blue. by default, these lines are disabled. enable them with the "history" input.版本注释
fixed typo开源脚本
秉承TradingView的精神,该脚本的作者将其开源,以便交易者可以查看和验证其功能。向作者致敬!您可以免费使用该脚本,但请记住,重新发布代码须遵守我们的网站规则。
免责声明
这些信息和出版物并非旨在提供,也不构成TradingView提供或认可的任何形式的财务、投资、交易或其他类型的建议或推荐。请阅读使用条款了解更多信息。
开源脚本
秉承TradingView的精神,该脚本的作者将其开源,以便交易者可以查看和验证其功能。向作者致敬!您可以免费使用该脚本,但请记住,重新发布代码须遵守我们的网站规则。
免责声明
这些信息和出版物并非旨在提供,也不构成TradingView提供或认可的任何形式的财务、投资、交易或其他类型的建议或推荐。请阅读使用条款了解更多信息。