OPEN-SOURCE SCRIPT
Dynamic Price Impulse
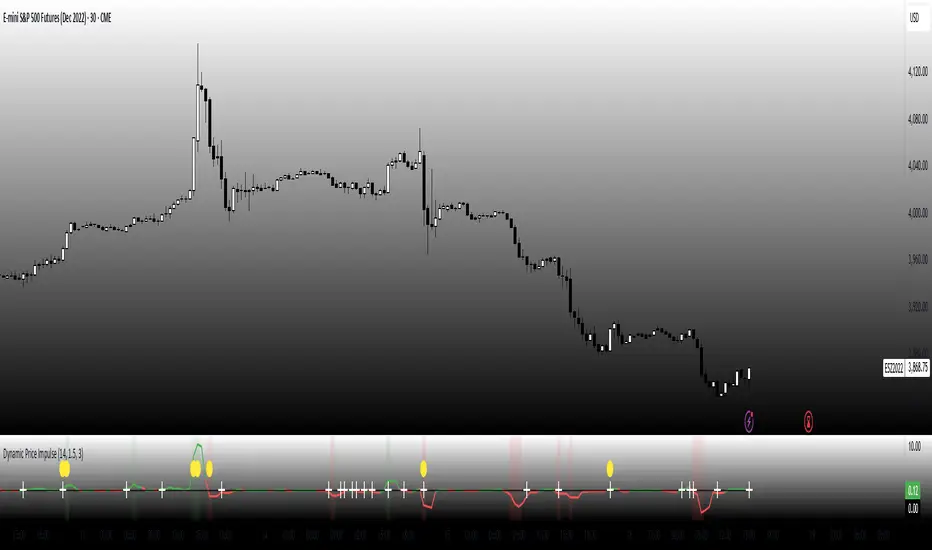
This indicator is designed to capture price momentum without the lag typically found in traditional oscillators.
Core Mechanics
Instead of using simple price differences, the indicator normalizes changes relative to the average true range (ATR), making it adaptive to different volatility regimes.
By squaring the normalized change while preserving its sign, the indicator responds more aggressively to stronger price moves while remaining sensitive to smaller ones.
The indicator identifies periods when volatility is expanding, which often precede significant price movements.
Trading Strategy Applications
1. Momentum Signals:
o When the indicator crosses above zero, look for long entries
o When it crosses below zero, look for short entries
o The stronger the impulse (farther from zero), the stronger the signal
2. Early Trend Detection:
o Volatility expansion markers (yellow circles) often appear at the beginning of new trends
o Use these as early warning signals to prepare for potential entries
3. Trend Continuation:
o Strong readings in the direction of the trend suggest continuation
o Weakening readings suggest the trend may be losing steam
4. Counter-Trend Opportunities:
o Look for divergences between price and the indicator for potential reversals
o When price makes a new high but the indicator doesn't, consider potential shorts (and vice versa)
Fine-Tuning
• Length (14): Controls the lookback period for ATR calculation. Lower values make it more responsive but noisier.
• Threshold (1.5): Determines how much volatility needs to expand to trigger the volatility expansion signal.
• Smoothing (3): Reduces noise in the signal. Higher values reduce false signals but introduce more lag.
开源脚本
秉承TradingView的精神,该脚本的作者将其开源,以便交易者可以查看和验证其功能。向作者致敬!您可以免费使用该脚本,但请记住,重新发布代码须遵守我们的网站规则。
免责声明
这些信息和出版物并非旨在提供,也不构成TradingView提供或认可的任何形式的财务、投资、交易或其他类型的建议或推荐。请阅读使用条款了解更多信息。
免责声明
这些信息和出版物并非旨在提供,也不构成TradingView提供或认可的任何形式的财务、投资、交易或其他类型的建议或推荐。请阅读使用条款了解更多信息。