OPEN-SOURCE SCRIPT
已更新 Intraday volatility on EOD chart
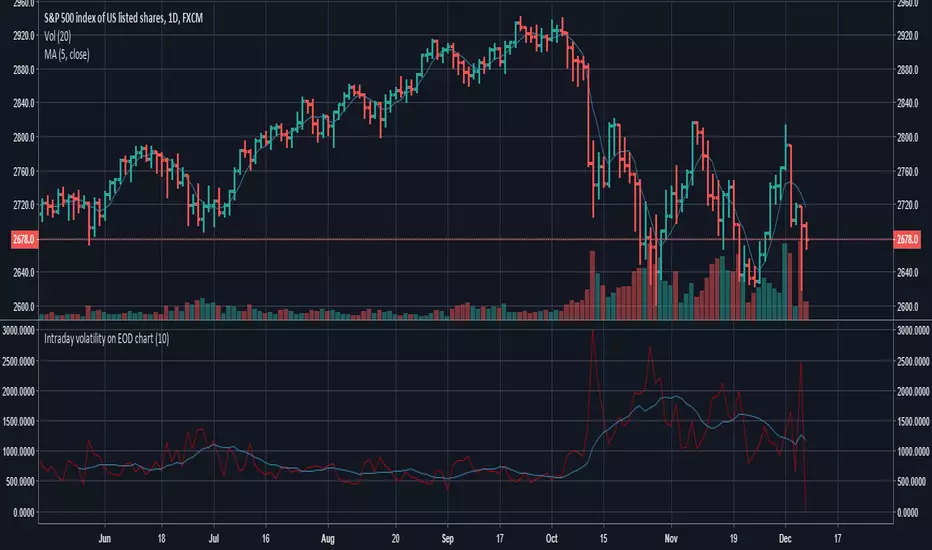
This indicator will allow you to compare Daily bars with Intraday insight.
Indicator draws the sum of high-low intraday bars on EOD timeframe.
The purpose is to compare TR or ATR with intraday data, because high-low on 1 daily bar says little about intraday bars inside.
You can replace the function (cum(high - low)) with whatever you need to calculate on intraday bars.
Indicator draws the sum of high-low intraday bars on EOD timeframe.
The purpose is to compare TR or ATR with intraday data, because high-low on 1 daily bar says little about intraday bars inside.
You can replace the function (cum(high - low)) with whatever you need to calculate on intraday bars.
版本注释
Added moving average开源脚本
秉承TradingView的精神,该脚本的作者将其开源,以便交易者可以查看和验证其功能。向作者致敬!您可以免费使用该脚本,但请记住,重新发布代码须遵守我们的网站规则。
免责声明
这些信息和出版物并非旨在提供,也不构成TradingView提供或认可的任何形式的财务、投资、交易或其他类型的建议或推荐。请阅读使用条款了解更多信息。
免责声明
这些信息和出版物并非旨在提供,也不构成TradingView提供或认可的任何形式的财务、投资、交易或其他类型的建议或推荐。请阅读使用条款了解更多信息。