PROTECTED SOURCE SCRIPT
已更新 ZTrend
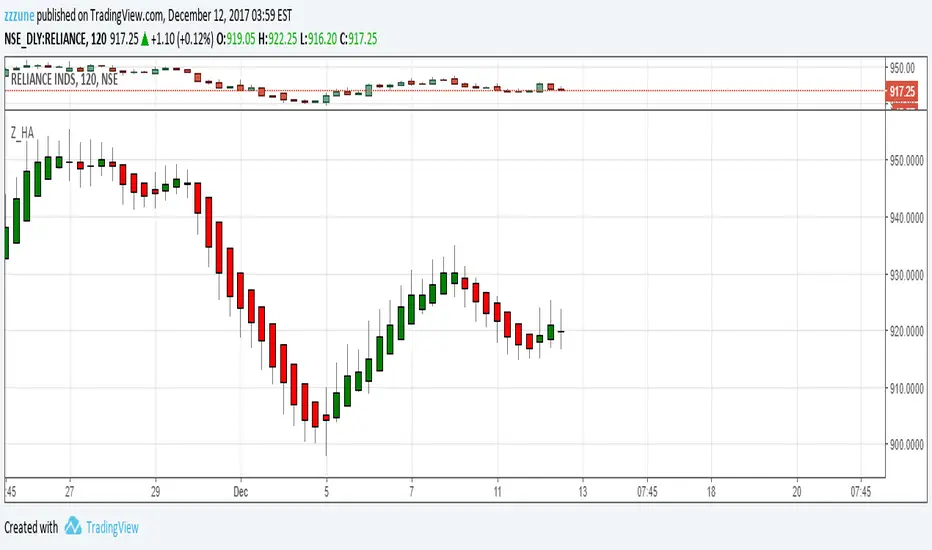
Pick Bottoms and Tops of a trend with ZTrend indicator. Use this indicator in multi frame for superb results.
If you are a Short Term trader, then use 2 hourly and Daily timeframe combination.
So after a downtrend, buy when 2 hourly candle turns green and wait until Daily candle also turns Green. Exit when 2 hourly candle turns red.
Ride the trend and do not exit until the 2 hourly candle turns Red.
When 2 consecutive candle body become thin, means end of a trend is near. Therefore either reduce the position or hedge.
Discipline is the key, therefore exit on the indication and do not wait in hope of marking turning your side.
版本注释
study("ZTrend", shorttitle="Z_HA", overlay=false)O = ema(open,3)
H = ema(high,3)
L = ema(low,3)
C = ema(close,3)
haclose = (O + H + L + C) / 4
haopen = na(haopen[1]) ? (O + C) / 2 : (haopen[1] + haclose[1]) / 2
hahigh = max(H, max(haopen, haclose))
halow = min(L, min(haopen, haclose))
plotcandle(haopen, hahigh, halow, haclose, title='Mod_HA', color=(haopen < haclose) ? green : red, wickcolor=gray)
版本注释
New update will plot ZTrend on the price chart itself.Use the Show/Hide button beside name of the instrument example show/Hide button just beside "NIFTY, 1D, NSE"
版本注释
Actual closing price of each bar now is also plotted in light blue line. This will help give an indication where exactly the actual price is with respect to ZTrend bars.受保护脚本
此脚本以闭源形式发布。 但是,您可以自由使用,没有任何限制 — 了解更多信息这里。
免责声明
这些信息和出版物并非旨在提供,也不构成TradingView提供或认可的任何形式的财务、投资、交易或其他类型的建议或推荐。请阅读使用条款了解更多信息。
免责声明
这些信息和出版物并非旨在提供,也不构成TradingView提供或认可的任何形式的财务、投资、交易或其他类型的建议或推荐。请阅读使用条款了解更多信息。