OPEN-SOURCE SCRIPT
已更新 Colored Klinger Volume Oscillator (CKVO)
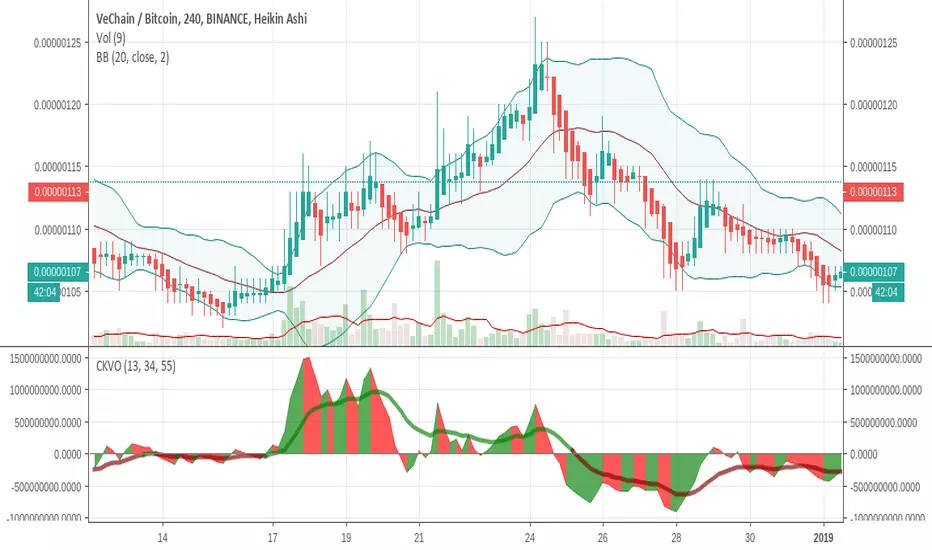
This is a color enhanced version of Klinger Volume Oscillator. I specially designed this to get maximum profit from highly volatile coins. This indicator is based on volume.
xTrigger (the line) shows if trend is bullish or bearish. It is the average of the area. You can clearly see the trend.
xKVO (the area) shows how buy and sell orders change. It rises while buys are increasing against sells, decreases while sells are increasing against buys.
The color or the area provides buy and sell signals. Green: buy. Red: sell. Gray: Undecided.
Of course there are false signals. You should use other indicators to confirm them.
I like to use RSI and Bollinger Bands along with it to eliminate false signals. Also check for double bottom and top, etc.
Its wise to check the general direction of coin using a bigger time frame using Heikin Aishi. For example 1W Heikin Ashi if you are trading on 1D.
In addition to buy signals the most important indication is divergence with the price. Before a trend change 2 kinds of divergences happen
- Trend line moves reverse to the price line
- Are a tops moves revers to the price tops. For example while there is a higher price top, there is a lower area top. Then its time to escape.
Motivation
It is common to suffer from failures while trading highly profitable but volatile coins like NULLS, REP, DLT, LRC, MFT, HOT, OAX, KEY, etc.
- Traders sell too early to ensure a profit. Sell at 10% and it goes 200%
- Traders buy too early. Traders buy and it drops yet another 50%
- Wrong patience. The trader keeps the faith and waits for days for the glorious days. And nothing happens.
I believe with this indicator I am able to solve those problems most of the time.
版本注释
Improved buy sell signals. Now they are not interleaved, instead continuous buy and sell periods版本注释
This code is based on from Harry Potter's code. Please donate him for his work and inspiration tradingview.com/v/Ka0gS4Kh/开源脚本
秉承TradingView的精神,该脚本的作者将其开源,以便交易者可以查看和验证其功能。向作者致敬!您可以免费使用该脚本,但请记住,重新发布代码须遵守我们的网站规则。
免责声明
这些信息和出版物并非旨在提供,也不构成TradingView提供或认可的任何形式的财务、投资、交易或其他类型的建议或推荐。请阅读使用条款了解更多信息。
开源脚本
秉承TradingView的精神,该脚本的作者将其开源,以便交易者可以查看和验证其功能。向作者致敬!您可以免费使用该脚本,但请记住,重新发布代码须遵守我们的网站规则。
免责声明
这些信息和出版物并非旨在提供,也不构成TradingView提供或认可的任何形式的财务、投资、交易或其他类型的建议或推荐。请阅读使用条款了解更多信息。