OPEN-SOURCE SCRIPT
Linear Regress on Price And Volume
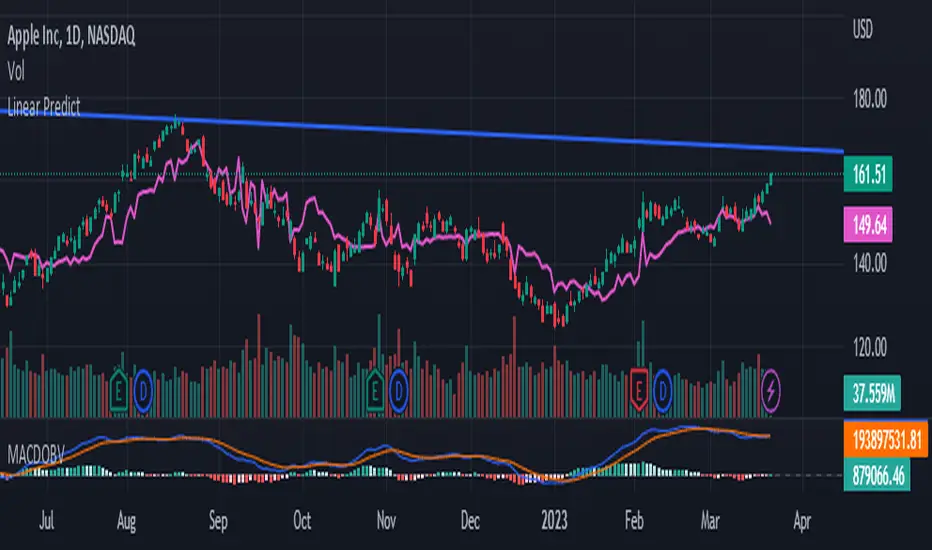
Linear regression is a statistical method used to model the relationship between a dependent variable and one or more independent variables. It assumes a linear relationship between the dependent variable and the independent variable(s) and attempts to fit a straight line that best describes the relationship.
In the context of predicting the price of a stock based on the volume, we can use linear regression to build a model that relates the price of the stock (dependent variable) to the volume (independent variable). The idea is to use lookback period to predict future prices based on the volume.
To build this indicator, we start by collecting data on the price of the stock and the volume over a selected of time or by default 21 days. We then plot the data on a scatter plot with the volume on the x-axis and the price on the y-axis. If there is a clear pattern in the data, we can fit a straight line to the data using a method called least squares regression. The line represents the best linear approximation of the relationship between the price and the volume.
Once we have the line, we can use it to make predictions. For example, if we observe a certain volume, we can use the line to estimate the corresponding price.
It's worth noting that linear regression assumes a linear relationship between the variables. In reality, the relationship between the price and the volume may be more complex, and other factors may also influence the price of the stock. Therefore, while linear regression can be a useful tool, it should be used in conjunction with other methods and should be interpreted with caution.
开源脚本
秉承TradingView的精神,该脚本的作者将其开源,以便交易者可以查看和验证其功能。向作者致敬!您可以免费使用该脚本,但请记住,重新发布代码须遵守我们的网站规则。
免责声明
这些信息和出版物并非旨在提供,也不构成TradingView提供或认可的任何形式的财务、投资、交易或其他类型的建议或推荐。请阅读使用条款了解更多信息。
开源脚本
秉承TradingView的精神,该脚本的作者将其开源,以便交易者可以查看和验证其功能。向作者致敬!您可以免费使用该脚本,但请记住,重新发布代码须遵守我们的网站规则。
免责声明
这些信息和出版物并非旨在提供,也不构成TradingView提供或认可的任何形式的财务、投资、交易或其他类型的建议或推荐。请阅读使用条款了解更多信息。