OPEN-SOURCE SCRIPT
CarrerasTrend
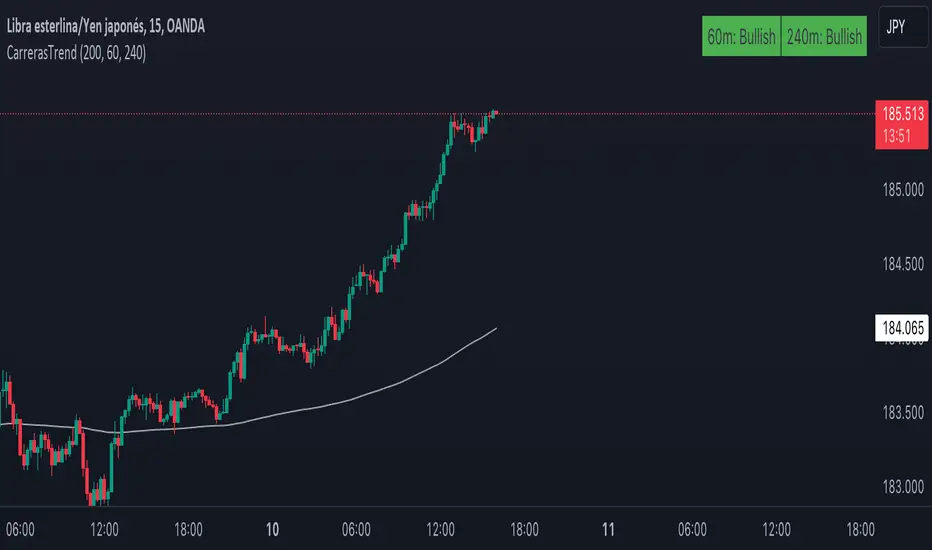
This indicator, created by Maximiliano Carreras, displays the trend based on the 200-period EMA (Adjustable) on the chart. The EMA is calculated based on data from the 1-hour and 4-hour charts (Both adjustable timeframes). The indicator labels the trend as "Bullish" if the closing price is above the EMA and as "Bearish" if it is below. The indicator is shown in the top right corner of the chart, providing information about the overall trend of the underlying asset.
You can also choose whether to display the EMA on the chart or not, as well as select between 1 or 2 timeframes for display.
Feel free to leave a comment if you liked it!
Ahora en Español:
Este indicador, creado por Maximiliano Carreras, muestra la tendencia basada en la EMA de 200 periodos (Modificable) en el gráfico. La EMA es calculada en función de los datos del gráfico de 1 y 4 horas (Modificables ambos tiempos). El indicador etiqueta la tendencia como "Bullish" (alcista) si el precio de cierre está por encima de la EMA y como "Bearish" (bajista) si está por debajo. El indicador se muestra en la esquina superior derecha del gráfico, proporcionando información sobre la tendencia general del activo subyacente.
También se puede mostrar o no la ema en el gráfico, al igual si elegir 1 o 2 tiempos para mostrar
Dejame un comentario si te gustó
开源脚本
秉承TradingView的精神,该脚本的作者将其开源,以便交易者可以查看和验证其功能。向作者致敬!您可以免费使用该脚本,但请记住,重新发布代码须遵守我们的网站规则。
免责声明
这些信息和出版物并非旨在提供,也不构成TradingView提供或认可的任何形式的财务、投资、交易或其他类型的建议或推荐。请阅读使用条款了解更多信息。
开源脚本
秉承TradingView的精神,该脚本的作者将其开源,以便交易者可以查看和验证其功能。向作者致敬!您可以免费使用该脚本,但请记住,重新发布代码须遵守我们的网站规则。
免责声明
这些信息和出版物并非旨在提供,也不构成TradingView提供或认可的任何形式的财务、投资、交易或其他类型的建议或推荐。请阅读使用条款了解更多信息。