OPEN-SOURCE SCRIPT
nitai Daily ATR – Top Right Panel
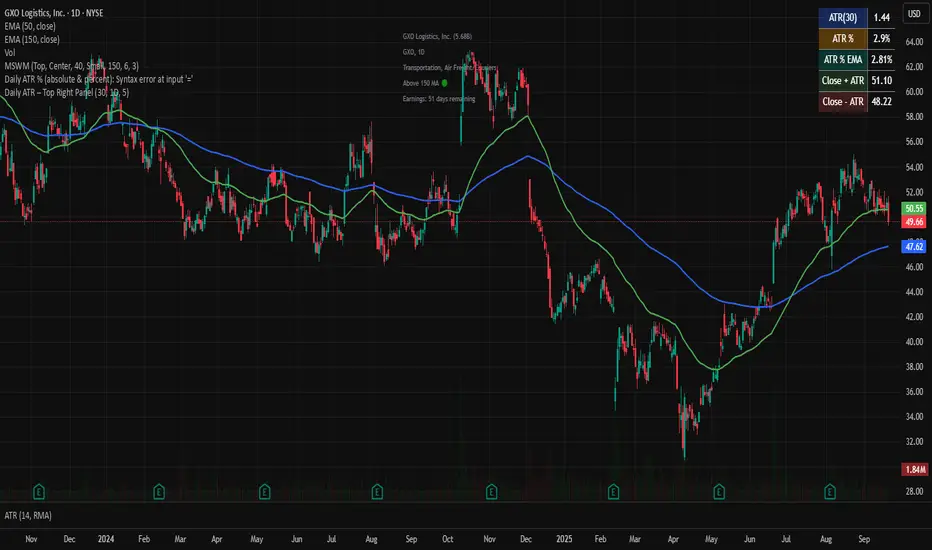
This script calculates the Daily ATR (Average True Range) and displays it in a compact panel on the top-right corner of the chart.
The panel includes:
• ATR in USD (based on a user-defined period, default = 30)
• ATR% – volatility expressed as a percentage of the price
• ATR% EMA – smoothed volatility trend using an Exponential Moving Average
• Close + ATR and Close – ATR – projected upper and lower daily range levels
Use this tool to quickly assess daily volatility, compare stocks by relative movement, and support risk management (e.g., stop-loss placement).
Designed for traders who want a clean and simple volatility dashboard directly on the chart.
开源脚本
秉承TradingView的精神,该脚本的作者将其开源,以便交易者可以查看和验证其功能。向作者致敬!您可以免费使用该脚本,但请记住,重新发布代码须遵守我们的网站规则。
免责声明
这些信息和出版物并非旨在提供,也不构成TradingView提供或认可的任何形式的财务、投资、交易或其他类型的建议或推荐。请阅读使用条款了解更多信息。
免责声明
这些信息和出版物并非旨在提供,也不构成TradingView提供或认可的任何形式的财务、投资、交易或其他类型的建议或推荐。请阅读使用条款了解更多信息。