OPEN-SOURCE SCRIPT
已更新 RSI Levels On Chart [MisterMoTA]
The values of the RSI Levels On Chart are calculated using Reverse Engineering RSI calculations by Giorgos Siligardos, Ph.D.
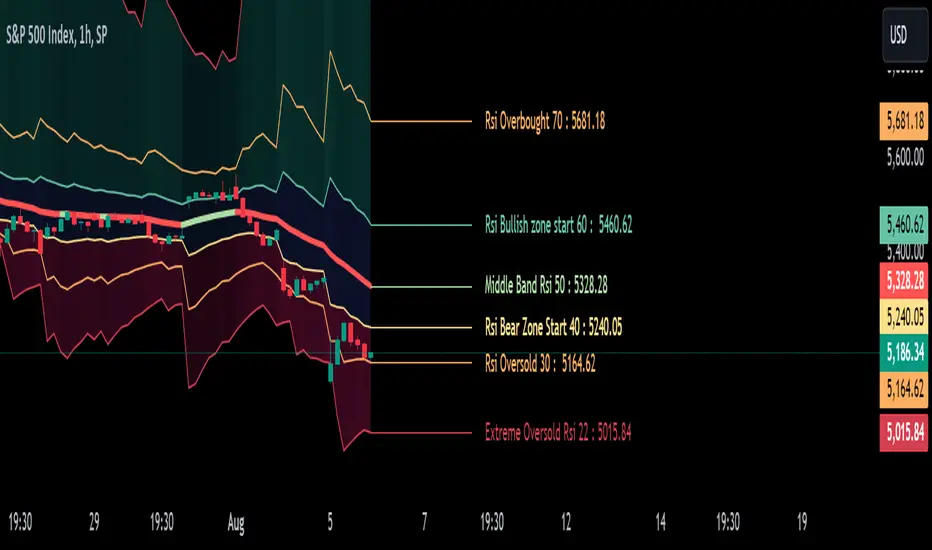
Instead of using only the 50 line of the RSI on chart I added options for users to define the Extreme Overbought and Oversold values, also simple Oversold and Overbought values, start of Bullish and Bearish zones and the 50 rsi value.
With the RSI Levels On Chart users are able to see on chart the price that a candles need to close for a certain value of the RSI. E.g. what price is needed for the RSI to be at oversold 30 or what would be the price when rsi will cross the 50 line.
The script has the 50 line color coded that will turn red when the line falling and will change to the user input color when it will be rising, helping users to see fast the clear trend of any asset on any timeframe from 1 second to 12 months.
I added few alerts for rsi overbought, oversold, extreme overbought and extreme oversold, crossing 50 level, crossing bullish or bearish zones values and also alerts for the 50 line falling or rising.
You can use RSI Levels On Chart as a simple indicator or you can add your favorite oscilator(s) to have a clear view of the trends of the markets, in this demo I added RSI + Divergences + Alerts [MisterMoTA] with a moving average set to 50 RMA.
版本注释
Updated the chart to not display the second indicator on publishing window of the script
版本注释
- removed decimals variable, so now the script wiill diplay the price with decimals auto by ticker decimals, no need to change on each asset the number of decimals anymore
版本注释
- I removed all the indicators inputs and values from the status line to improve chart visibility
- Upgraded the code to version 6 of pine script
开源脚本
秉承TradingView的精神,该脚本的作者将其开源,以便交易者可以查看和验证其功能。向作者致敬!您可以免费使用该脚本,但请记住,重新发布代码须遵守我们的网站规则。
免责声明
这些信息和出版物并非旨在提供,也不构成TradingView提供或认可的任何形式的财务、投资、交易或其他类型的建议或推荐。请阅读使用条款了解更多信息。
开源脚本
秉承TradingView的精神,该脚本的作者将其开源,以便交易者可以查看和验证其功能。向作者致敬!您可以免费使用该脚本,但请记住,重新发布代码须遵守我们的网站规则。
免责声明
这些信息和出版物并非旨在提供,也不构成TradingView提供或认可的任何形式的财务、投资、交易或其他类型的建议或推荐。请阅读使用条款了解更多信息。