OPEN-SOURCE SCRIPT
[blackcat] L3 Gann Slope
Level 3
Background
William Gann (Wilian D. Gann) is one of the most famous investors in the twentieth century. His outstanding achievements in the stock and futures markets are unparalleled. The theory he created that perfectly combines time and price has been It is still talked about and highly praised by the investment community.
Function
The slope is the degree of the angle line relative to the time axis (X axis). Volatility is the ratio of unit amplitude to unit time. At the heart of Gann angles is the determination of volatility. Gann angle is the movement of price defined by time unit and price unit. Each angle is determined by the relationship between time and price. In the rising angle, the angle with the larger slope means that the stock price is rising stronger and falling. In a trend line, the larger the slope, the stronger the downtrend.
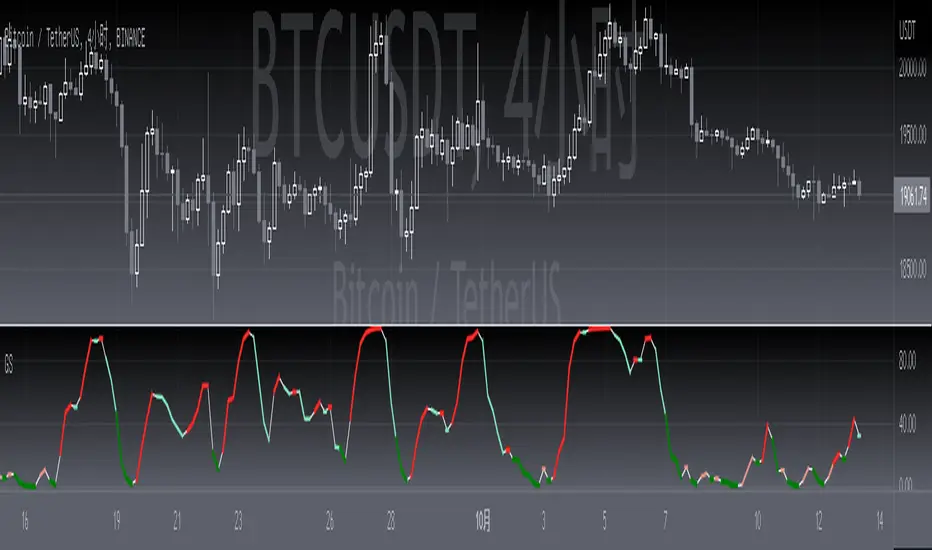
This technical indicator speaks of the Gann slope expressed as an oscillator. Its value varies from 0 to 100. The positive slope means rising, and the negative slope means falling. For rising and falling, the strength of rising and falling is distinguished by the thickness and color of the oscillating line:
1. The thin white line represents the basic oscillator curve and has no special meaning.
2. Light red indicates that an uptrend is established, and dark red indicates a very strong uptrend.
3. Light green indicates an established downtrend, dark green indicates a very strong downtrend.
Remarks
Feedbacks are appreciated.
Background
William Gann (Wilian D. Gann) is one of the most famous investors in the twentieth century. His outstanding achievements in the stock and futures markets are unparalleled. The theory he created that perfectly combines time and price has been It is still talked about and highly praised by the investment community.
Function
The slope is the degree of the angle line relative to the time axis (X axis). Volatility is the ratio of unit amplitude to unit time. At the heart of Gann angles is the determination of volatility. Gann angle is the movement of price defined by time unit and price unit. Each angle is determined by the relationship between time and price. In the rising angle, the angle with the larger slope means that the stock price is rising stronger and falling. In a trend line, the larger the slope, the stronger the downtrend.
This technical indicator speaks of the Gann slope expressed as an oscillator. Its value varies from 0 to 100. The positive slope means rising, and the negative slope means falling. For rising and falling, the strength of rising and falling is distinguished by the thickness and color of the oscillating line:
1. The thin white line represents the basic oscillator curve and has no special meaning.
2. Light red indicates that an uptrend is established, and dark red indicates a very strong uptrend.
3. Light green indicates an established downtrend, dark green indicates a very strong downtrend.
Remarks
Feedbacks are appreciated.
开源脚本
秉承TradingView的精神,该脚本的作者将其开源,以便交易者可以查看和验证其功能。向作者致敬!您可以免费使用该脚本,但请记住,重新发布代码须遵守我们的网站规则。
Avoid losing contact!Don't miss out! The first and most important thing to do is to join my Discord chat now! Click here to start your adventure: discord.com/invite/ZTGpQJq 防止失联,请立即行动,加入本猫聊天群: discord.com/invite/ZTGpQJq
免责声明
这些信息和出版物并非旨在提供,也不构成TradingView提供或认可的任何形式的财务、投资、交易或其他类型的建议或推荐。请阅读使用条款了解更多信息。