OPEN-SOURCE SCRIPT
已更新 1-40-F&O EMA Screener
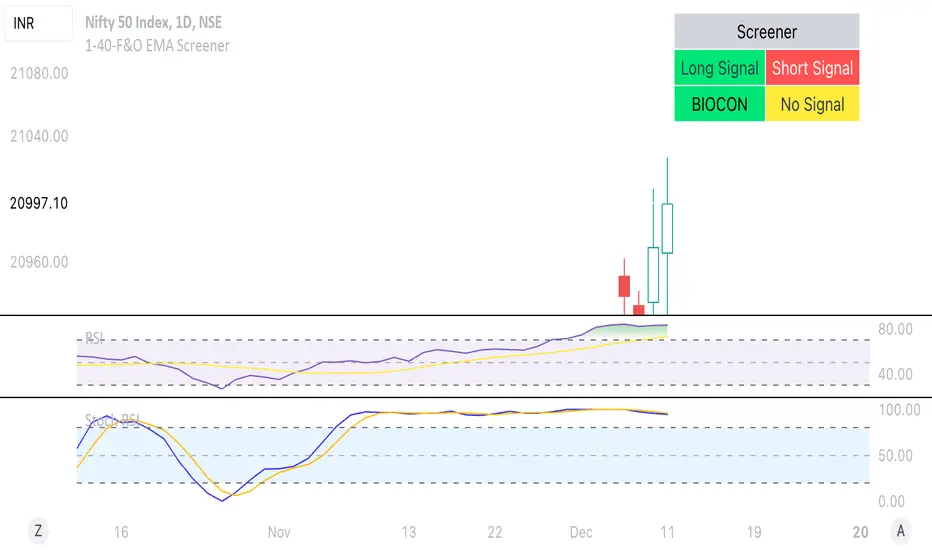
This Pine Script is a TradingView indicator named "1-40-F&O EMA Screener." It calculates and displays four moving averages (MA1, MA2, MA3, and MA4) and the Relative Strength Index (RSI) on a chart. The script generates buy and short signals based on certain conditions involving the moving averages and RSI. Additionally, it includes a screener section that displays a table of symbols with buy and short signals.
Here's a breakdown of the key components:
Moving Averages (MAs):
MA1: Simple Moving Average with length len1 (green line).
MA2: Simple Moving Average with length len2 (red line).
MA3: Simple Moving Average with length len3 (orange line).
MA4: Simple Moving Average with length len4 (black line).
Relative Strength Index (RSI):
The RSI is calculated with a length of rsiLengthInput and a source specified by rsiSourceInput.
Conditions for Buy and Short Signals:
Buy Signal: When MA1 is above MA2 and MA3, and RSI is above 50.
Short Signal: When MA1 is below MA2 and MA3, and RSI is below 50.
Signal Plots:
Buy signals are plotted as "B" below the corresponding bars.
Short signals are plotted as "S" above the corresponding bars.
Background Coloring:
Bars are colored based on their opening and closing prices.
Screener Section:
The script defines a watchlist (gticker) with 40 predefined symbols.
It then calls the getSignal function for each symbol to identify buy and short signals.
The results are displayed in a table with long signals in green and short signals in red.
Table Theming:
The script allows customization of the table's background, frame, and text colors, as well as the text size.
The table's location on the chart can also be customized.
版本注释
This Pine Script is a TradingView indicator named "1-40-F&O EMA Screener." It calculates and displays four moving averages (MA1, MA2, MA3, and MA4) and the Relative Strength Index (RSI) on a chart. The script generates buy and short signals based on certain conditions involving the moving averages and RSI. Additionally, it includes a screener section that displays a table of symbols with buy and short signals.Here's a breakdown of the key components:
Moving Averages (MAs):
MA1: Simple Moving Average with length len1 (green line).
MA2: Simple Moving Average with length len2 (red line).
MA3: Simple Moving Average with length len3 (orange line).
MA4: Simple Moving Average with length len4 (black line).
Relative Strength Index (RSI):
The RSI is calculated with a length of rsiLengthInput and a source specified by rsiSourceInput.
Conditions for Buy and Short Signals:
Buy Signal: When MA1 is above MA2 and MA3, and RSI is above 50.
Short Signal: When MA1 is below MA2 and MA3, and RSI is below 50.
Signal Plots:
Buy signals are plotted as "B" below the corresponding bars.
Short signals are plotted as "S" above the corresponding bars.
Background Coloring:
Bars are colored based on their opening and closing prices.
Screener Section:
The script defines a watchlist (gticker) with 40 predefined symbols.
It then calls the getSignal function for each symbol to identify buy and short signals.
The results are displayed in a table with long signals in green and short signals in red.
Table Theming:
The script allows customization of the table's background, frame, and text colors, as well as the text size.
The table's location on the chart can also be customized.
开源脚本
秉承TradingView的精神,该脚本的作者将其开源,以便交易者可以查看和验证其功能。向作者致敬!您可以免费使用该脚本,但请记住,重新发布代码须遵守我们的网站规则。
免责声明
这些信息和出版物并非旨在提供,也不构成TradingView提供或认可的任何形式的财务、投资、交易或其他类型的建议或推荐。请阅读使用条款了解更多信息。
开源脚本
秉承TradingView的精神,该脚本的作者将其开源,以便交易者可以查看和验证其功能。向作者致敬!您可以免费使用该脚本,但请记住,重新发布代码须遵守我们的网站规则。
免责声明
这些信息和出版物并非旨在提供,也不构成TradingView提供或认可的任何形式的财务、投资、交易或其他类型的建议或推荐。请阅读使用条款了解更多信息。