PROTECTED SOURCE SCRIPT
[DEM] Ichimoku Bars
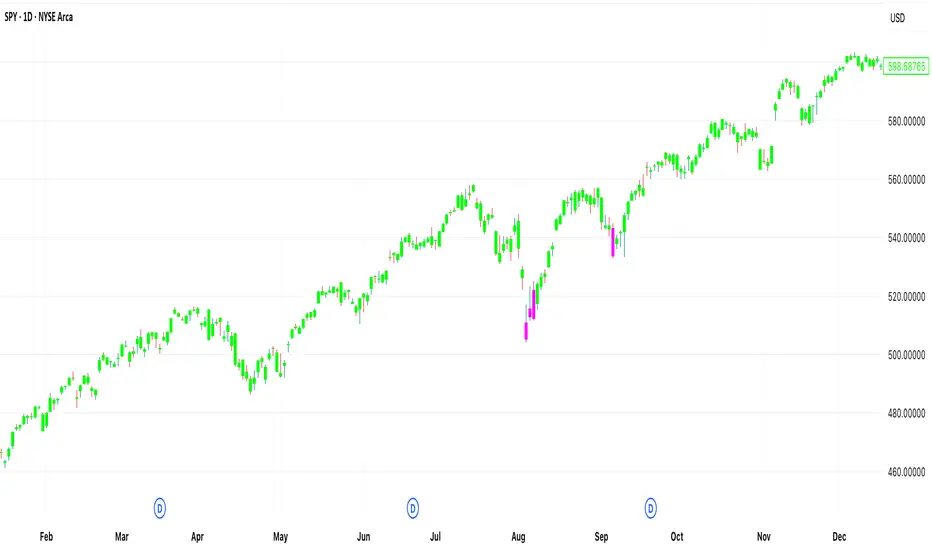
[DEM] Ichimoku Bars is designed to color price bars based on their relationship to the Ichimoku Cloud (Kumo) by comparing the current close price to both Leading Span A and Leading Span B from the traditional Ichimoku system, but with added smoothing modifications. The indicator calculates the standard Ichimoku components using Donchian midlines for the Conversion and Base lines, then creates smoothed versions of Leading Span A (20-period RMA of the average between Conversion and Base lines) and Leading Span B (20-period RMA of the 52-period Donchian midline), both displaced forward by the lagging span period. Bars are colored green when price is above both leading spans (indicating strong bullish conditions above the cloud), red when price is below both leading spans (indicating strong bearish conditions below the cloud), and magenta when price is within the cloud (indicating neutral or transitional conditions), providing traders with immediate visual feedback about price position relative to the Ichimoku equilibrium zone.
受保护脚本
此脚本以闭源形式发布。 但是,您可以自由使用,没有任何限制 — 了解更多信息这里。
免责声明
这些信息和出版物并非旨在提供,也不构成TradingView提供或认可的任何形式的财务、投资、交易或其他类型的建议或推荐。请阅读使用条款了解更多信息。
受保护脚本
此脚本以闭源形式发布。 但是,您可以自由使用,没有任何限制 — 了解更多信息这里。
免责声明
这些信息和出版物并非旨在提供,也不构成TradingView提供或认可的任何形式的财务、投资、交易或其他类型的建议或推荐。请阅读使用条款了解更多信息。