OPEN-SOURCE SCRIPT
已更新 TICK and Price Action Indicator for NQ 5 minute
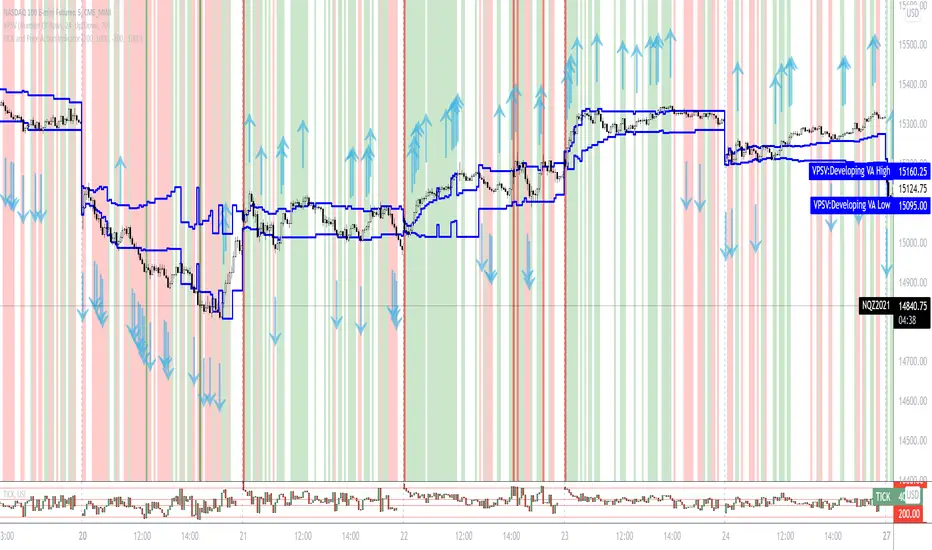
This indicator for 5 minute NQ charts utilises TICK index and price action.
Where TICK opens beyond +1000/-1000 this is an overbought/oversold signal.
Similarly, when TICK closes below -200 it is a sell signal, and above +200 it is a buy signal.
This indicator colours the NQ bars based on the closing/opening values of the previous TICK.
It also draws arrows where price action (close above previous high, close below previous low) is in concordance with TICK behaviour.
版本注释
Debugged code that limited the number of buy signals; debugged code that would otherwise show a number of short signals开源脚本
秉承TradingView的精神,该脚本的作者将其开源,以便交易者可以查看和验证其功能。向作者致敬!您可以免费使用该脚本,但请记住,重新发布代码须遵守我们的网站规则。
免责声明
这些信息和出版物并非旨在提供,也不构成TradingView提供或认可的任何形式的财务、投资、交易或其他类型的建议或推荐。请阅读使用条款了解更多信息。
开源脚本
秉承TradingView的精神,该脚本的作者将其开源,以便交易者可以查看和验证其功能。向作者致敬!您可以免费使用该脚本,但请记住,重新发布代码须遵守我们的网站规则。
免责声明
这些信息和出版物并非旨在提供,也不构成TradingView提供或认可的任何形式的财务、投资、交易或其他类型的建议或推荐。请阅读使用条款了解更多信息。