OPEN-SOURCE SCRIPT
Price vs 10/50DMA (%) — single label
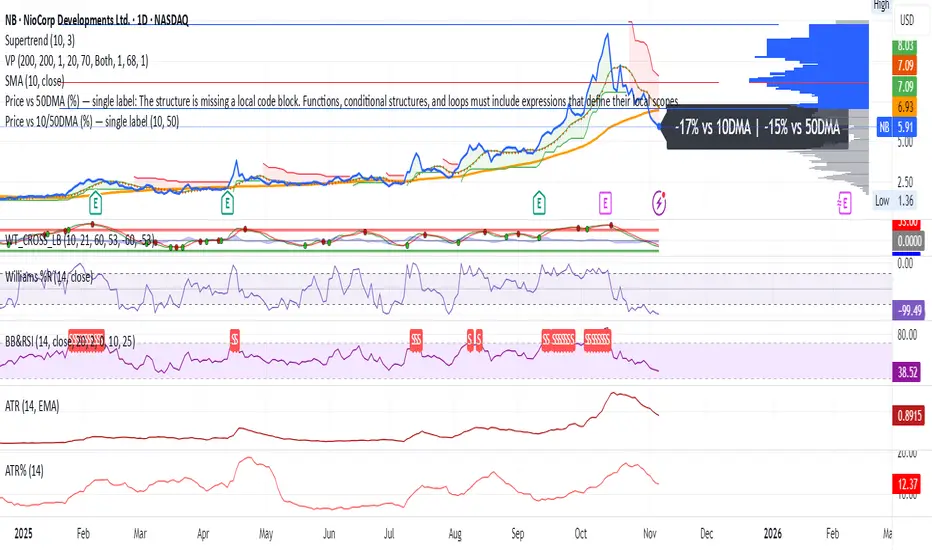
This TradingView script shows how far the current price is from its 10-day and 50-day moving averages (DMAs), expressed as percentages, and displays both values as a single label near the latest candle — for example, “+3% vs 10DMA | +8% vs 50DMA.” You can switch between simple and exponential moving averages using the “Use EMA” checkbox, and adjust the period lengths in the input panel. To use it, simply copy the code into TradingView’s Pine Editor, click Add to chart, and you’ll see one live label updating each bar along with the plotted 10- and 50-day average lines.
开源脚本
秉承TradingView的精神,该脚本的作者将其开源,以便交易者可以查看和验证其功能。向作者致敬!您可以免费使用该脚本,但请记住,重新发布代码须遵守我们的网站规则。
Ex-Fidelity analyst.
Love markets.
Love markets.
免责声明
这些信息和出版物并非旨在提供,也不构成TradingView提供或认可的任何形式的财务、投资、交易或其他类型的建议或推荐。请阅读使用条款了解更多信息。
开源脚本
秉承TradingView的精神,该脚本的作者将其开源,以便交易者可以查看和验证其功能。向作者致敬!您可以免费使用该脚本,但请记住,重新发布代码须遵守我们的网站规则。
Ex-Fidelity analyst.
Love markets.
Love markets.
免责声明
这些信息和出版物并非旨在提供,也不构成TradingView提供或认可的任何形式的财务、投资、交易或其他类型的建议或推荐。请阅读使用条款了解更多信息。