OPEN-SOURCE SCRIPT
true trend
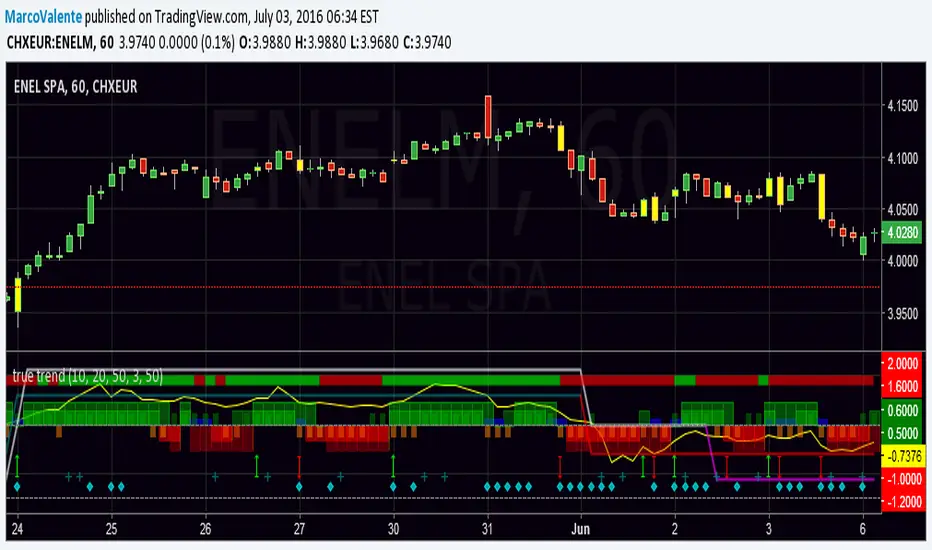
Easy way to look at the Trend , but still accurate. Top bar is DI +, DI - , bars change in yellow when a swing happen, histogram show the increase/decrease of Min and Max and Open-Close; 2 lines moving between +1 and - 1 folloiwng 3 Ema crossing ; a Dot (diamond shape) appear on the botton when volatility increase and finally a " + " show when volume are much bigger the usually. Yellow line on top is Willams % and help us to find top and bottom of the market.
开源脚本
秉承TradingView的精神,该脚本的作者将其开源,以便交易者可以查看和验证其功能。向作者致敬!您可以免费使用该脚本,但请记住,重新发布代码须遵守我们的网站规则。
免责声明
这些信息和出版物并非旨在提供,也不构成TradingView提供或认可的任何形式的财务、投资、交易或其他类型的建议或推荐。请阅读使用条款了解更多信息。
开源脚本
秉承TradingView的精神,该脚本的作者将其开源,以便交易者可以查看和验证其功能。向作者致敬!您可以免费使用该脚本,但请记住,重新发布代码须遵守我们的网站规则。
免责声明
这些信息和出版物并非旨在提供,也不构成TradingView提供或认可的任何形式的财务、投资、交易或其他类型的建议或推荐。请阅读使用条款了解更多信息。