OPEN-SOURCE SCRIPT
Function 2 Point Line using UNIX TIMESTAMP V1
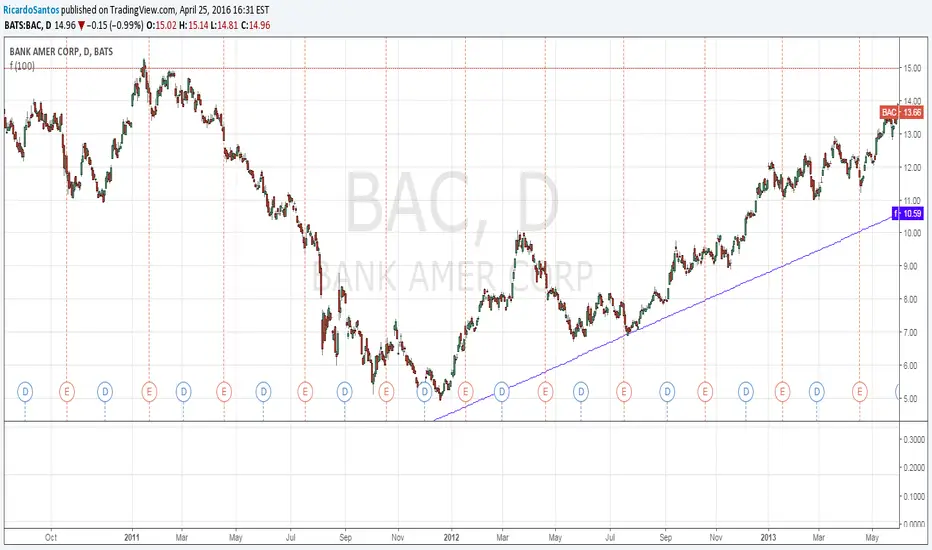
experimental:
draws a line from 2 vectors(price, time)
update:
reformatted the function,
added automatic detection of the period multiplier by approximation(gets a bit goofy with stocks/week time),
example using timestamp() function.
offsetting is still bugged, i cant find a way around it atm.
draws a line from 2 vectors(price, time)
update:
reformatted the function,
added automatic detection of the period multiplier by approximation(gets a bit goofy with stocks/week time),
example using timestamp() function.
offsetting is still bugged, i cant find a way around it atm.
开源脚本
秉承TradingView的精神,该脚本的作者将其开源,以便交易者可以查看和验证其功能。向作者致敬!您可以免费使用该脚本,但请记住,重新发布代码须遵守我们的网站规则。
免责声明
这些信息和出版物并非旨在提供,也不构成TradingView提供或认可的任何形式的财务、投资、交易或其他类型的建议或推荐。请阅读使用条款了解更多信息。
开源脚本
秉承TradingView的精神,该脚本的作者将其开源,以便交易者可以查看和验证其功能。向作者致敬!您可以免费使用该脚本,但请记住,重新发布代码须遵守我们的网站规则。
免责声明
这些信息和出版物并非旨在提供,也不构成TradingView提供或认可的任何形式的财务、投资、交易或其他类型的建议或推荐。请阅读使用条款了解更多信息。