OPEN-SOURCE SCRIPT
Tops & Bottoms Finder
Introduction
I already shared a method to estimate tops and bottoms (1), the number of parameters could lead to optimization issues so i tried to make a simpler method. In this method i use a simple rescaling method based on individual direction deviation. I will explain further details below.
The Indicator
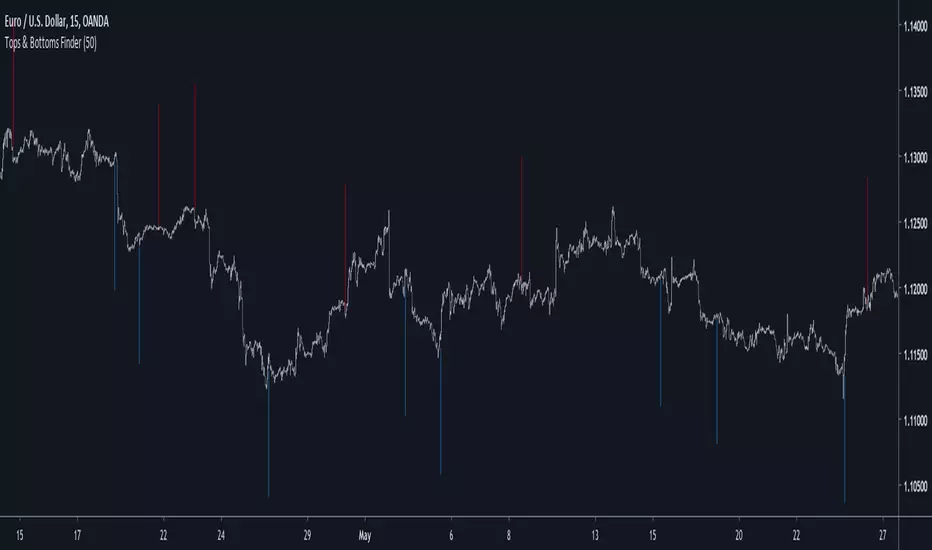
I use as source for the entire calculation an exponential moving average, the first reaction to this choice would be to think that i wanted to filter signals in order to reduce them, but the truth is that i wanted to have more signals instead, this is because the first calculations involving standard deviations are based on price direction, so by using a smooth input we can get more persistent values in a and b, but its totally up to you to use whatever you want in a, just take into account that less smooth = less signals, this is why i used this calculation process.

a = close and length = 7

a = least squares moving average and length = 25
So you could use pretty much everything you want as input.
Conclusion
The accuracy of such indicators is still relatively low but i presented a way to estimate tops and bottoms without using highest/lowest or differencing thus creating a totally new approach. I encourage you to experiment with it and share your results. If you learned something with this post then i'am happy :)
Notes
Based on several complaints i will have to leave even sooner, i think the 7 of June will be a good day, so if you need something i encourage you to ask me now. With the hope you can understand.
Thanks for reading !
(1)
I already shared a method to estimate tops and bottoms (1), the number of parameters could lead to optimization issues so i tried to make a simpler method. In this method i use a simple rescaling method based on individual direction deviation. I will explain further details below.
The Indicator
I use as source for the entire calculation an exponential moving average, the first reaction to this choice would be to think that i wanted to filter signals in order to reduce them, but the truth is that i wanted to have more signals instead, this is because the first calculations involving standard deviations are based on price direction, so by using a smooth input we can get more persistent values in a and b, but its totally up to you to use whatever you want in a, just take into account that less smooth = less signals, this is why i used this calculation process.
a = close and length = 7
a = least squares moving average and length = 25
So you could use pretty much everything you want as input.
Conclusion
The accuracy of such indicators is still relatively low but i presented a way to estimate tops and bottoms without using highest/lowest or differencing thus creating a totally new approach. I encourage you to experiment with it and share your results. If you learned something with this post then i'am happy :)
Notes
Based on several complaints i will have to leave even sooner, i think the 7 of June will be a good day, so if you need something i encourage you to ask me now. With the hope you can understand.
Thanks for reading !
(1)
开源脚本
秉承TradingView的精神,该脚本的作者将其开源,以便交易者可以查看和验证其功能。向作者致敬!您可以免费使用该脚本,但请记住,重新发布代码须遵守我们的网站规则。
Check out the indicators we are making at luxalgo: tradingview.com/u/LuxAlgo/
"My heart is so loud that I can't hear the fireworks"
"My heart is so loud that I can't hear the fireworks"
免责声明
这些信息和出版物并非旨在提供,也不构成TradingView提供或认可的任何形式的财务、投资、交易或其他类型的建议或推荐。请阅读使用条款了解更多信息。