The Minervini Qualifier indicator calculates the qualifying conditions from Mark Minervini’s book “Trade like a Stock Market Wizard”.
The condition matching is been shown as fill color inside an SMA 20day envelope curve.
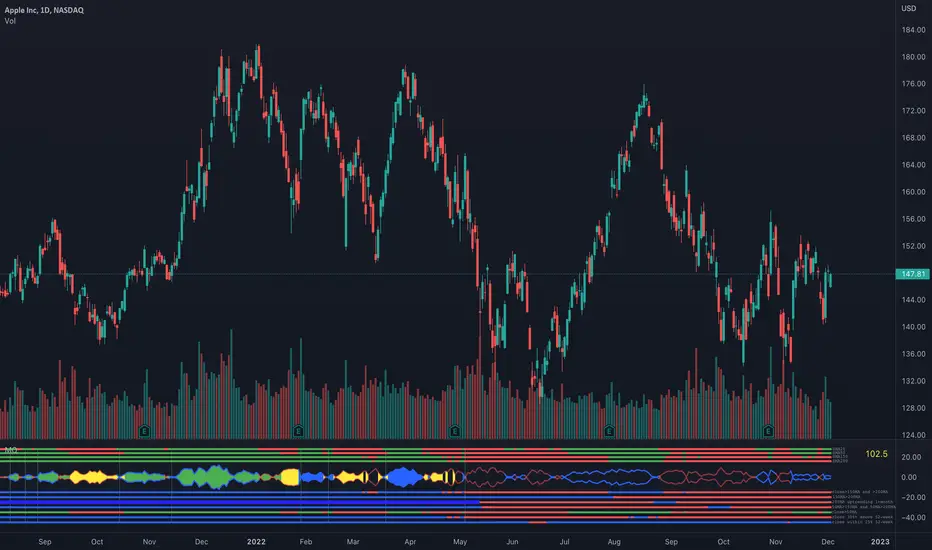
If the envelope color is red, current close price is below the SMA20 and when blue, current close price is above the SMA20. The fill color can be transparent (not matching qualifying conditions), yellow (matching all conditions except close is still below SMA50), green (all conditions match, SMA200 trending for at least one month up) or blue (all conditions match, SMA200 trending up for at least 5 months)
As I wanted also to see which of the qualifying conditions match over time, I’ve added add. lines, each representing one conditions. If it matches, line color is blue, or red if not. Use the data windows (right side), so you know what line represents which condition. Can be turned on/off (default:on)
In addition, a relative strength is been calculated, to compare the stock to a reference index. It is just one possible way to calculate it, might be different to what Mark Minervini is using. If the shown value (top right) is above 100, stock performs better compared to reference index (can be set in settings), when below 100, stock performs worse compared to reference index. Can be turned on/off (default:on)
How to use it:
For more details, read Mark’s book and watch his videos.
Limitations:
It gives only useful information on daily timeframe
(No financial advise, for testing purposes only)
The condition matching is been shown as fill color inside an SMA 20day envelope curve.
If the envelope color is red, current close price is below the SMA20 and when blue, current close price is above the SMA20. The fill color can be transparent (not matching qualifying conditions), yellow (matching all conditions except close is still below SMA50), green (all conditions match, SMA200 trending for at least one month up) or blue (all conditions match, SMA200 trending up for at least 5 months)
As I wanted also to see which of the qualifying conditions match over time, I’ve added add. lines, each representing one conditions. If it matches, line color is blue, or red if not. Use the data windows (right side), so you know what line represents which condition. Can be turned on/off (default:on)
In addition, a relative strength is been calculated, to compare the stock to a reference index. It is just one possible way to calculate it, might be different to what Mark Minervini is using. If the shown value (top right) is above 100, stock performs better compared to reference index (can be set in settings), when below 100, stock performs worse compared to reference index. Can be turned on/off (default:on)
How to use it:
For more details, read Mark’s book and watch his videos.
Limitations:
It gives only useful information on daily timeframe
(No financial advise, for testing purposes only)
版本注释
New revision:- added SMA20 (configurable), SMA50, SMA150 and SMA200 lines above the envelope curve.
Color coding: green means close is above SMA, red means close is below SMA. Can be turned on/off.
- some code cleanup
版本注释
- added some alerts - when Minervini conditions are met
- when Minervini conditions are not met any longer
- potential buy signal - SMA200 crossover and Minervini conditions (at least light) are met
- strong uptrend signal when close is xx% (setting) above 52week low
- Potential buy signal is drawn as vertical green line (can be switched on/off, default on)
- added label (can be switched on/off, default off) next to the vertical lines for better understanding / identification
- changed default Reference ticker IDs
版本注释
Typo correction
Known bug: label doesn't stay stable left aligned on the lines below the envelope curve (no idea why this is the case)
开源脚本
秉承TradingView的精神,该脚本的作者将其开源,以便交易者可以查看和验证其功能。向作者致敬!您可以免费使用该脚本,但请记住,重新发布代码须遵守我们的网站规则。
免责声明
这些信息和出版物并非旨在提供,也不构成TradingView提供或认可的任何形式的财务、投资、交易或其他类型的建议或推荐。请阅读使用条款了解更多信息。
免责声明
这些信息和出版物并非旨在提供,也不构成TradingView提供或认可的任何形式的财务、投资、交易或其他类型的建议或推荐。请阅读使用条款了解更多信息。