OPEN-SOURCE SCRIPT
10-Year Bond Yields (Interest Rate Differential)
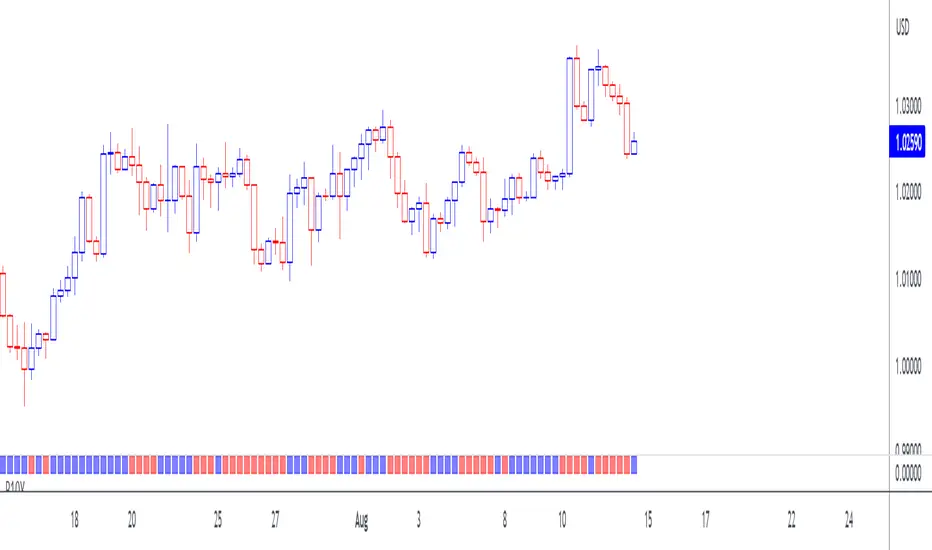
With this little script, I have attempted to incorporate fundamental data (in this case, 10-year bond yields) into technical analysis . When pairing two currencies, the one with a higher bond interest rate usually appreciates when the interest rate differential widens, or, to use a simple example: in a currency pair A vs. B, with A showing a higher bond yield than B, a widening interest rate gap is likely to help A and create a buying opportunity (shown as a blue square at the bottom of the chart), while the opposite is true when the gap tightens (sell signal, red square).
While long-term investors know about and make use of the importance of bond yield fluctuations, most short-term traders tend to dismiss the idea of using fundamental data, mostly for lack of quantifiability and limited impact in an intraday environment. After extensive backtesting on daily and intraday charts (6-12 hours), however, I realized this indicator still managed to produce useful results (less useful than on monthly and yearly charts, to be fair, but still useful enough), especially when paired with simple price-driven indicators, such as Heikin Ashi or linear regression .
My personal (and thus subjective) thoughts: worth a try. Buy and sell signals frequently contradicted both more popular indicators and my gut feeling and managed to take out losing trades that I had considered trades with a high winning probability. In other words, when the market lures traders into seemingly promising trading decisions, this indicator might give you an early warning, especially when you manage to adjust period and continuity parameters to your trading strategy.
Currency pairs used in this script are all possible combinations of the eight majors. Each security has been assigned a name ("inst01" to "inst08" in the code) and a broker; if you make changes to the code, be sure not to mess with currency and broker names as this would render the entire script useless. Good luck trading, and feel free to suggest improvements!
开源脚本
秉承TradingView的精神,该脚本的作者将其开源,以便交易者可以查看和验证其功能。向作者致敬!您可以免费使用该脚本,但请记住,重新发布代码须遵守我们的网站规则。
免责声明
这些信息和出版物并非旨在提供,也不构成TradingView提供或认可的任何形式的财务、投资、交易或其他类型的建议或推荐。请阅读使用条款了解更多信息。
免责声明
这些信息和出版物并非旨在提供,也不构成TradingView提供或认可的任何形式的财务、投资、交易或其他类型的建议或推荐。请阅读使用条款了解更多信息。