PROTECTED SOURCE SCRIPT
Dynamic Buy/Sell Volume Visualizer [wjdtks255]
Indicator Description:
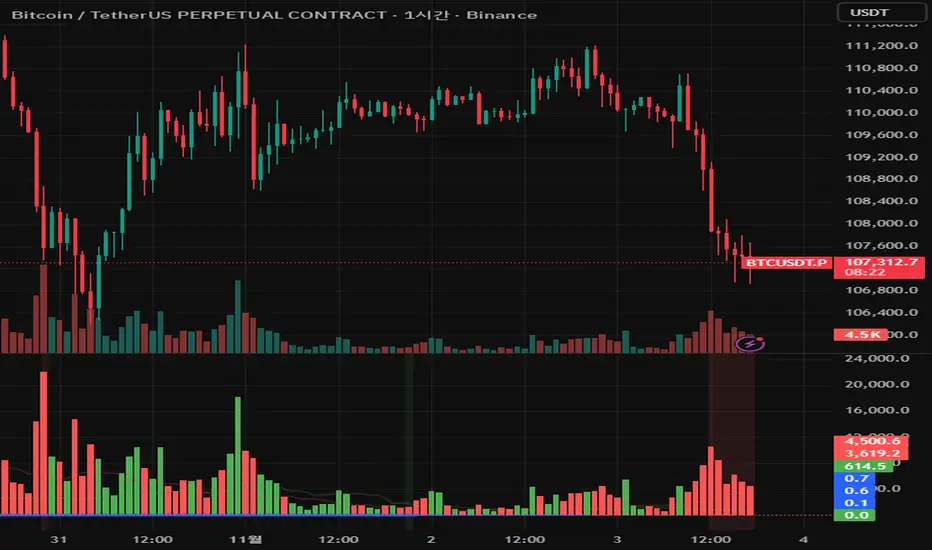
The Dynamic Buy/Sell Volume Visualizer separates bullish and bearish volumes and calculates their moving averages with customizable colors and transparency. It dynamically visualizes buying strength relative to selling pressure by plotting a volume ratio line that changes color intensity and line thickness based on volume dominance. Background colors highlight strong buying or selling phases when volumes exceed thresholds. Volume bars and moving averages provide clear market volume context, and horizontal lines mark key neutral and strength levels.
How It Works:
Bull and bear volumes are distinguished by candle direction.
Moving averages (SMA) smooth volume data with user-defined length and customizable visual styles.
The volume ratio (buy volume MA over total MA) reflects buying strength from 0 (full sell) to 1 (full buy).
The volume ratio line’s color and thickness change dynamically according to the ratio’s magnitude.
Background colors alert users when buy or sell volumes surpass thresholds.
Volume bars and moving averages give detailed volume insights, complemented by horizontal lines showing neutral (0.5), strong buy (0.7), and strong sell (0.3) levels.
Trading Method:
Use the volume ratio line to gauge current market pressure; above 0.7 suggests strong buying, below 0.3 indicates strong selling.
Observe background color shifts as quick visual cues for volume surges or declines.
Combine this volume visualization with price actions to time entries and exits.
Customize moving average parameters to align the indicator with your trading style.
受保护脚本
此脚本以闭源形式发布。 但是,您可以自由使用它,没有任何限制 — 在此处了解更多信息。
免责声明
这些信息和出版物并不意味着也不构成TradingView提供或认可的金融、投资、交易或其它类型的建议或背书。请在使用条款阅读更多信息。
免责声明
这些信息和出版物并不意味着也不构成TradingView提供或认可的金融、投资、交易或其它类型的建议或背书。请在使用条款阅读更多信息。