OPEN-SOURCE SCRIPT
G-Channel Trend Detection
The G-Channel Trend Detection is a technical analysis indicator developed by Alex Grover. It is designed to identify and visualize the prevailing trend direction in financial markets by efficiently calculating the upper and lower extremities of price movements.
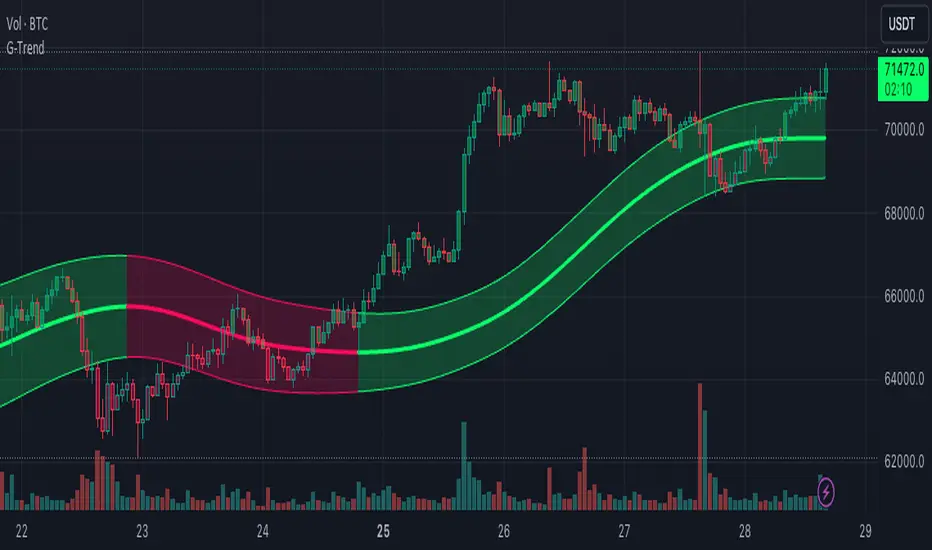
The indicator consists of a centerline (filter) and two outer bands (upper and lower bands) that adapt to the volatility of the price action. The centerline represents the core trend, while the outer bands provide dynamic support and resistance levels.
Key features of the G-Channel Trend Detection indicator:
1. Efficient calculation: The indicator uses an optimized algorithm to calculate the upper and lower extremities of price movements, providing a smooth and responsive representation of the trend.
2. Customizable parameters: Users can adjust the indicator's parameters, such as the number of poles, sampling period, and true range multiplier, to fine-tune the sensitivity and responsiveness of the bands to price changes.
3. Lag reduction: The indicator offers a reduced lag mode and a fast response mode, which help to minimize the delay between price movements and the indicator's signals, providing more timely and accurate trend detection.
4. Trend identification: The color of the centerline and the fill between the outer bands change based on the direction of the trend. An upward-sloping centerline with a green color suggests a bullish trend, while a downward-sloping centerline with a red color indicates a bearish trend.
5. Price action confirmation: The indicator also colors the price bars based on their position relative to the centerline and outer bands. This feature helps traders to confirm the strength and direction of the trend visually.
Traders can use the G-Channel Trend Detection indicator to identify the overall market trend, potential trend reversals, and to make informed trading decisions based on the direction and strength of the trend. The indicator can be used in conjunction with other technical analysis tools, such as momentum oscillators and volume indicators, to confirm signals and validate trading strategies.
It's important to note that while the G-Channel Trend Detection indicator can provide valuable insights into market trends, it should not be relied upon as a sole decision-making tool. As with any technical indicator, it is subject to limitations and should be used in combination with other analysis methods, risk management techniques, and sound trading principles.
开源脚本
秉承TradingView的精神,该脚本的作者将其开源,以便交易者可以查看和验证其功能。向作者致敬!您可以免费使用该脚本,但请记住,重新发布代码须遵守我们的网站规则。
✅💰⚡ Become part of the community get early get access here:
daviddtech.com
🔥Telegram Group:
t.me/DaviddTech
⚡ Videos & Tutorials :
youtube.com/channel/UC7NJLsf6IonOy8QI8gt5BeA?sub_confirmation=1
♥ @DaviddTech
daviddtech.com
🔥Telegram Group:
t.me/DaviddTech
⚡ Videos & Tutorials :
youtube.com/channel/UC7NJLsf6IonOy8QI8gt5BeA?sub_confirmation=1
♥ @DaviddTech
免责声明
这些信息和出版物并非旨在提供,也不构成TradingView提供或认可的任何形式的财务、投资、交易或其他类型的建议或推荐。请阅读使用条款了解更多信息。