OPEN-SOURCE SCRIPT
已更新 Diagonal Support and Resistance Trend Lines
A simple indicator to plot trend lines.
1. Adjust the "Pivot Lookback" (default: 20) to control pivot sensitivity. Larger values detect more significant pivots.
2. Adjust the "Max Trend Lines" (default: 4) to control how many support/resistance lines are drawn.
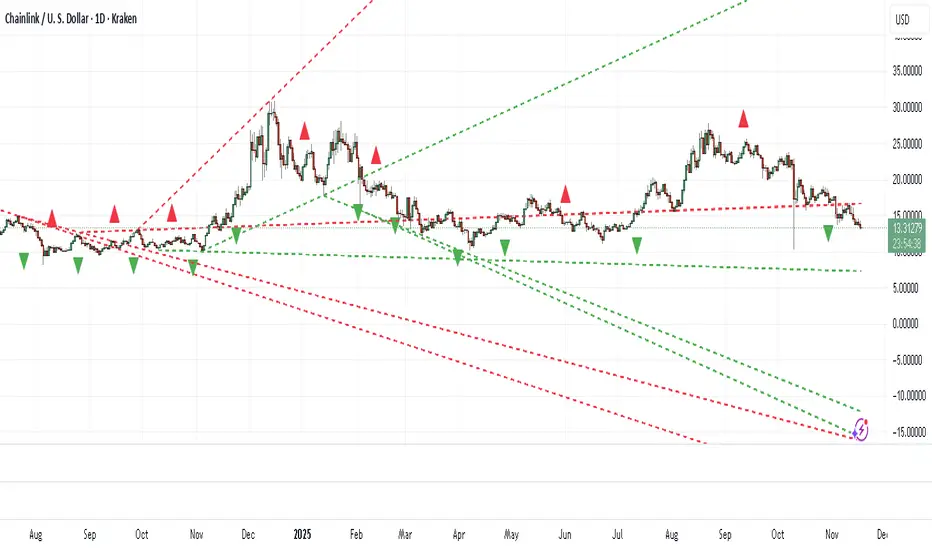
The indicator will plot:
1. Red dashed lines for resistance (based on pivot highs).
2. Green dashed lines for support (based on pivot lows).
3. Small red triangles above bars for pivot highs and green triangles below bars for pivot lows.
1. Adjust the "Pivot Lookback" (default: 20) to control pivot sensitivity. Larger values detect more significant pivots.
2. Adjust the "Max Trend Lines" (default: 4) to control how many support/resistance lines are drawn.
The indicator will plot:
1. Red dashed lines for resistance (based on pivot highs).
2. Green dashed lines for support (based on pivot lows).
3. Small red triangles above bars for pivot highs and green triangles below bars for pivot lows.
版本注释
Updated to v6 and added option to display dotted, dash, or solid lines.版本注释
Edit版本注释
You can now set the thickness of trend line.开源脚本
秉承TradingView的精神,该脚本的作者将其开源,以便交易者可以查看和验证其功能。向作者致敬!您可以免费使用该脚本,但请记住,重新发布代码须遵守我们的网站规则。
免责声明
这些信息和出版物并非旨在提供,也不构成TradingView提供或认可的任何形式的财务、投资、交易或其他类型的建议或推荐。请阅读使用条款了解更多信息。
免责声明
这些信息和出版物并非旨在提供,也不构成TradingView提供或认可的任何形式的财务、投资、交易或其他类型的建议或推荐。请阅读使用条款了解更多信息。